
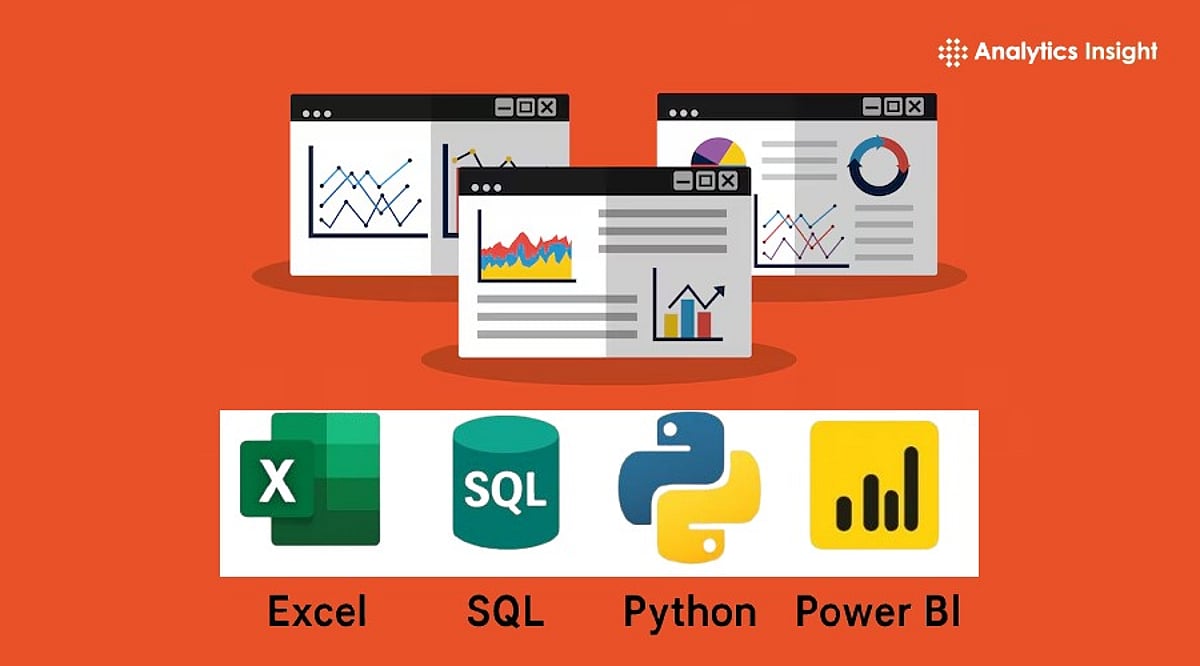
Data analytics is the process of examining data to uncover useful insights. Every organization collects vast amounts of information daily—sales figures, customer feedback, website traffic, and growth metrics. Companies leverage this data to make smarter decisions and plan ahead. Mastering data analytics is a highly sought-after skill, and employers increasingly value professionals who can work across multiple tools. The four most popular tools in this domain are Excel, SQL, Python, and Power BI. Each serves a distinct purpose: Excel handles calculations and reporting; SQL retrieves data from databases; Power BI transforms data into visual dashboards; and Python manages large datasets and complex analyses. This guide provides a concise cheat sheet covering essential formulas, commands, and functions for these tools.
Excel Cheat Sheet
Excel remains a staple for everyday data analysis due to its simplicity and versatility. It is widely used for creating reports, analyzing numbers, and organizing information. Key formulas include SUM, AVERAGE, COUNT, MIN, and MAX for basic calculations; IF for conditional logic; XLOOKUP and VLOOKUP for searching large tables; and INDEX and MATCH for advanced lookups. Essential features include Pivot Tables to summarize data, Conditional Formatting to highlight key values, Power Query for data cleaning, and Data Validation to prevent input errors. Industry surveys indicate that over 75% of data professionals still use Excel daily.
SQL Cheat Sheet
SQL (Structured Query Language) is the standard for working with relational databases. Most businesses store critical data in databases, and SQL enables quick and efficient retrieval. Core commands include SELECT, FROM, WHERE, ORDER BY, GROUP BY, HAVING, DISTINCT, and LIMIT. Joins are crucial: INNER JOIN returns matching records; LEFT JOIN returns all records from the left table; RIGHT JOIN returns all from the right; and FULL OUTER JOIN returns all from both. Advanced features include Common Table Expressions (CTEs), CASE statements, subqueries, window functions (ROW_NUMBER, RANK, DENSE_RANK, LEAD, LAG). SQL remains indispensable because most business data resides in databases.
Python Cheat Sheet
Python is a powerful programming language for data analysis, valued for its readability and extensive library ecosystem. The top five libraries are Pandas (data manipulation), NumPy (numerical operations), Matplotlib and Plotly (visualization), and Scikit-learn (machine learning). Key Pandas commands include read_csv(), head(), info(), describe(), shape, columns, groupby(), merge(), sort_values(), drop_duplicates(), and fillna(). Python excels at data cleansing, automation, statistical analysis, and building AI models.
Power BI Cheat Sheet
Power BI, a Microsoft business intelligence tool, converts raw data into interactive charts, reports, and dashboards. Core components include Power Query (data preparation), Data Model (table relationships), DAX (formulas), Visualizations (charts), Dashboards, and Power BI Service (cloud sharing). Common chart types are bar, line, column, pie, maps, KPI cards, matrix tables, and slicers. According to Microsoft, Power BI is used by over 375,000 organizations and has more than 30 million monthly active users, reflecting its widespread adoption.
Latest Trends in Data Analytics
Data analytics continues to evolve with emerging technologies. Artificial intelligence accelerates analysis, enabling tools to answer business questions via natural language instead of code. Cloud technology facilitates storage and processing of massive datasets. Real-time reporting is increasingly common as organizations demand up-to-the-minute insights. Enhanced data security and self-service analytics are also top priorities. Industry experts highlight AI-powered analytics, robust data governance, and accessible business intelligence as the biggest current trends.
Final Thoughts
A comprehensive data analytics cheat sheet saves time and streamlines workflows. Excel handles numerical tasks and reporting; SQL retrieves database information; Python manages large-scale and advanced analysis; Power BI creates clear visual dashboards. Together, these four tools cover every essential aspect of data analytics. Mastering them builds a solid foundation for a successful career in today’s data-driven world.
Frequently Asked Questions
- What is a data analytics cheat sheet? A quick reference guide summarizing important formulas, commands, and functions for popular analytics tools.
- Why is Excel important for data analytics? It helps organize data, perform calculations, create reports, and identify trends using simple formulas and built-in features.
- Why should SQL be part of data analytics skills? SQL enables access, filtering, and analysis of data stored in databases, which most businesses rely on daily.
- What is Python used for in data analytics? Python is used for data cleaning, task automation, visualization, statistical analysis, and building machine learning models.
- Why do companies use Power BI? Power BI transforms raw data into clear dashboards and reports, helping businesses understand information and make better decisions.
Leave a Reply