Category: Cryptocurrency

  • Ethereum Wallet Growth: What It Really Reveals About Network Adoption and Price

    Ethereum Wallet Growth: What It Really Reveals About Network Adoption and Price

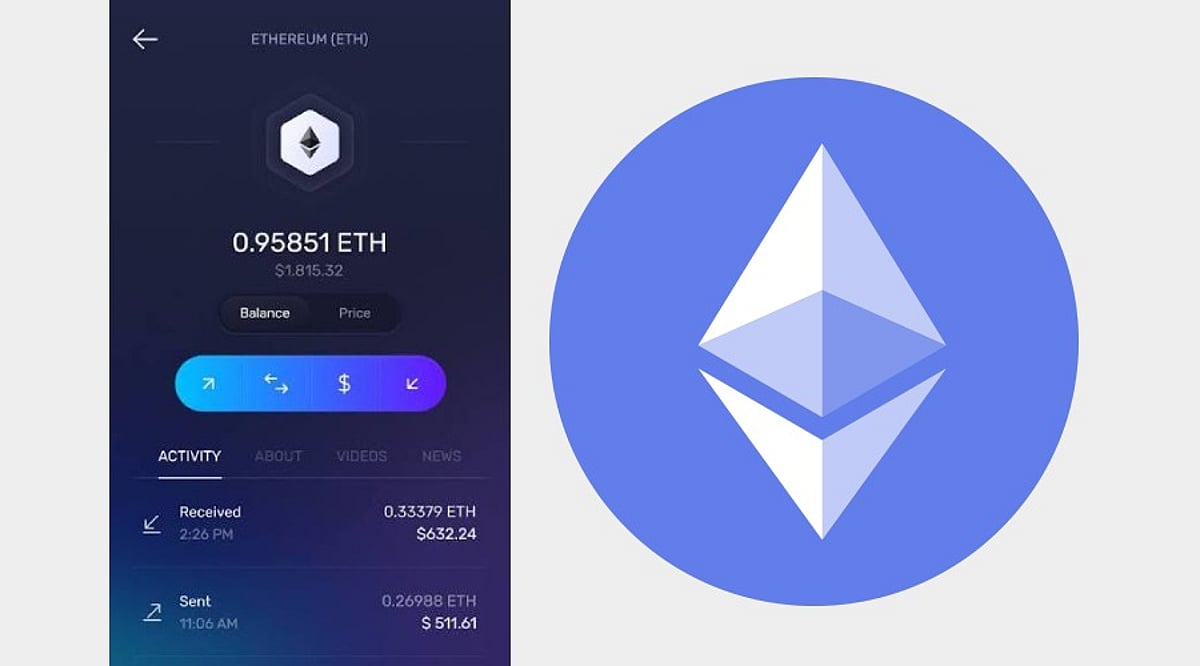
    Ethereum wallet growth is frequently cited as evidence that blockchain adoption is accelerating. More addresses holding ETH or interacting with the network can indicate expanding participation, but wallet statistics are easy to misinterpret. An Ethereum address does not necessarily represent one person, and one person can control hundreds or thousands of addresses. Understanding that distinction is essential when interpreting on-chain adoption.

    Wallet Addresses Measure Accounts, Not People

    Ethereum is pseudonymous. Blockchain data records addresses and transactions rather than verified individual identities. Consequently, counting addresses cannot produce an accurate count of Ethereum users. A trader might operate separate wallets for long-term holdings, decentralized finance, NFTs, and testing. Institutions and exchanges can control numerous addresses, while a single exchange address can represent assets belonging to thousands of customers. Automated bots can create additional addresses without representing additional human users.

    Active Addresses Provide Different Information

    Analysts therefore frequently examine active addresses rather than total addresses. An active-address metric generally counts addresses that send or receive transactions during a defined period. Growth can indicate increasing blockchain activity, but it still measures participating addresses rather than unique people. Activity can also change based on market conditions. During periods of intense trading, token launches, or airdrop campaigns, existing users may create more wallets or interact more frequently. Address growth can therefore increase even without equivalent growth in the number of people using Ethereum.

    Layer 2 Networks Complicate Ethereum Metrics

    Ethereum’s scaling strategy creates another measurement challenge. Increasing amounts of user activity occur on Layer 2 networks rather than directly on Ethereum Mainnet. Rollups execute transactions outside Layer 1 before settling data or proofs back to Ethereum. A Mainnet-only wallet metric can miss activity occurring across Ethereum’s broader scaling ecosystem. Wallet applications themselves increasingly support multiple Layer 2 networks. Ethereum.org’s wallet directory evaluates products partly on Ethereum-native and Layer 2 support, illustrating how wallets are evolving into multi-network interfaces.

    Wallet Growth Does Not Equal Investment Demand

    More wallets also do not automatically mean ETH demand or price must rise. An address can hold negligible ETH, interact primarily with stablecoins, or exist only temporarily. Conversely, institutional custodians may hold substantial ETH through relatively few addresses. Useful adoption analysis therefore combines wallet statistics with transaction activity, fees, stablecoin transfers, decentralized application usage, Layer 2 activity, and capital flows. No individual metric captures the entire network.

    Final Thoughts

    Ethereum wallet growth measures changes in blockchain addresses, not a verified population of investors or users. It can reveal important activity trends, particularly when combined with active-address and transaction data, but interpreting it as direct evidence of user growth or future ETH price performance can produce misleading conclusions.

    Also Read: How Ethereum Scales Without Sacrificing Decentralization

    FAQs

    1. What does Ethereum wallet growth measure?
      Ethereum wallet growth tracks changes in blockchain addresses holding assets or interacting with the network. It can indicate expanding activity but does not directly measure the number of individual Ethereum users.
    2. Does one Ethereum address represent one user?
      No. One person can control multiple Ethereum addresses, while exchanges and custodians can use individual addresses to hold assets belonging to thousands of customers.
    3. What are active Ethereum addresses?
      Active addresses generally refer to addresses that send or receive transactions during a specified period. They provide insight into network activity but still cannot identify the number of unique human users.
    4. Why do Layer 2 networks complicate Ethereum wallet statistics?
      Much of Ethereum’s activity occurs on Layer 2 networks before settling back to Ethereum. Looking only at Mainnet addresses may miss activity taking place across the broader Ethereum ecosystem.
    5. Does increasing Ethereum wallet growth mean ETH prices will rise?
      Not necessarily. Wallet growth does not directly measure investment demand, as addresses can hold small balances or mainly use stablecoins and applications. ETH prices are influenced by many additional market factors.

    Disclaimer: Analytics Insight does not provide financial advice or guidance on cryptocurrencies and stocks. Also note that the cryptocurrencies mentioned/listed on the website could potentially be risky, i.e., designed to induce you to invest financial resources that may be lost forever and not be recoverable once investments are made. This article is provided for informational purposes and does not constitute investment advice. You are responsible for conducting your own research (DYOR) before making any investments. Read more about the financial risks involved here.

  • Ethereum Approaches $2,800 Resistance as Spot ETF Inflows Reach $575.9M

    Ethereum Approaches $2,800 Resistance as Spot ETF Inflows Reach $575.9M

    Ethereum is hovering near $2,760 after a seven-day gain of roughly 14%, with the price pressing against resistance around $2,786 but unable to secure a sustained move above $2,800. The latest push comes as US spot Ethereum ETFs record a third consecutive day of net inflows and BitMine confirms another weekly ETH purchase.

    Spot Ethereum ETFs Extend Inflow Streak

    US spot Ethereum ETFs brought in $270 million in net inflows on September 21, according to Farside Investors. BlackRock’s ETHA led with $110.1 million, while Fidelity’s FETH added $73 million. That followed $143.7 million in inflows on September 18, which snapped a three-day outflow streak.

    Farside later recorded $162.2 million in net inflows for September 22, extending the streak to three sessions and lifting the combined total to $575.9 million. Some earlier reports citing two days and roughly $413.8 million captured the streak before the latest session was counted.

    The fund data confirms demand for ETF shares during those sessions, but it does not reveal how much of ETH’s price gain came from that demand. Ethereum rose alongside the broader crypto market, and flow data alone cannot isolate a single cause for the move.

    BitMine Adds More ETH to Its Treasury

    BitMine confirmed on September 21 that it purchased 27,562 ETH during the previous week. The company held 5,983,940 ETH as of September 20, representing about 4.9% of reported supply, and has said it aims to own 5%. BitMine also reported staking 5,067,309 ETH, roughly 85% of its holdings.

    Shortly after the update, Lookonchain flagged a 12,500 ETH withdrawal from Kraken linked to BitMine. The transfer may signal another addition, but BitMine’s confirmed balance predates the withdrawal. The company has not included those 12,500 coins in its cited holdings update, so its reported total remains 5.98 million ETH.

    BitMine chairman Tom Lee expects institutions to increase crypto exposure in the fourth quarter of 2026, saying such buying could add meaningful upside to gains since June 30. The comment reflects an expectation rather than confirmed future demand.

    Ethereum Faces Key Resistance Below $2,800

    The daily chart shows initial resistance at $2,786, followed by $2,894. ETH has held above $2,700 after pulling back from the first level. Nearby support sits at $2,626 and $2,544, with the 20-day exponential moving average around $2,537. The relative strength index near 71 points to strong recent momentum but also raises the risk of short-term pullbacks.

    One technical analysis identified $2,775 to $2,825 as a possible consolidation zone, with $3,050 as an initial upside target. The same analysis suggested a drop below $2,560 to $2,565 would raise doubts about the market structure. These are conditional readings, not guaranteed price levels.

    Ethereum also spent time below $2,800 during its 2025 rally. That earlier pattern adds context, but it does not set a timetable for 2026. For now, steady ETF inflows and BitMine’s confirmed purchase accompany a price test that remains unresolved: ETH has approached $2,800 without sustaining a move above it.

  • Ethereum Classic Surges 7.49% as Broader Crypto Rally Boosts ETC Trading Volume

    Ethereum Classic Surges 7.49% as Broader Crypto Rally Boosts ETC Trading Volume

    Ethereum Classic (ETC) jumped 7.49% to USD 9.18 as a widespread cryptocurrency market rally drove demand and trading activity across digital assets. The token traded between USD 8.56 and USD 9.29 after opening near USD 8.52. Meanwhile, Bitcoin gained 6.39% to USD 86,334, and the market saw approximately USD 800 million in short liquidations.

    The latest advance extended ETC’s seven-day gain to 26.93%. The cryptocurrency has also risen 18.48% this month and 30.19% over the past 90 days. Despite the rebound, ETC remains 50.73% lower over one year and trades 94.44% below its record high of USD 165.15 from May 7, 2021.

    Broad Crypto Rally Drives ETC Higher

    The wider cryptocurrency market provided the clearest catalyst behind ETC’s latest move. Bitcoin advanced 6.39% during the session, while XRP rose 9.79%. At the same time, the market recorded approximately USD 800 million in short liquidations. Such liquidations occur when traders betting on lower prices must close positions by buying assets back, which can accelerate an existing rally.

    As major cryptocurrencies gained, speculative activity also spread into smaller assets such as Ethereum Classic. ETC currently has a market capitalization of about USD 1.45 billion. Its smaller size means larger percentage moves can occur when market-wide trading activity rises sharply. Still, the available information contains no ETC-specific announcement that explains the price increase. There were no cited network upgrades, exchange listings, ETF developments, or other project events behind the move.

    ETC Trading Volume Surges as Momentum Builds

    Trading activity strengthened alongside the price increase. Daily ETC volume climbed to USD 0.0967 million, representing a 116.16% increase over its 30-day average. Its volume-to-market-cap ratio also reached 6.66%, compared to the average of 3.08%. Therefore, the latest price increase came with stronger market participation rather than minimal trading activity. Rising volume accompanied ETC’s push toward the session high of USD 9.29.

    The token also trades above its tracked moving averages and above the peaks of its recent 90-day range. This places USD 9.29 at the center of the next short-term price test. Even so, the rally follows a sharp rebound from depressed levels. ETC remains deeply below its historical peak and still records a substantial year-over-year decline.

    The available data does not include ETC-specific funding rates, open interest, or perpetual futures liquidations. As a result, the role of ETC derivatives cannot be measured from the supplied figures. Instead, the reported USD 800 million liquidation figure applies to the wider crypto market. The current evidence therefore links part of ETC’s momentum to sector-wide short covering rather than ETC-specific futures activity.

    USD 9.29 Becomes ETC’s Immediate Price Test

    The session high at USD 9.29 now forms the nearest reference point for ETC traders. The asset reached the level after beginning the period near USD 8.52. Under a short-term strategy, a daily close above USD 9.29 would mark a breakout signal, with a stop level near USD 8.84 and a possible profit-taking area at USD 10.50. A trailing stop could adjust exposure as the price changes.

    For a medium-term approach, the USD 8.03 to USD 8.52 area is identified as a potential pullback zone. A daily close below USD 7.75 would invalidate this setup. Meanwhile, the same framework keeps USD 9.29 as the initial target before any possible extension toward USD 10.50. The setup therefore depends heavily on whether ETC can preserve its recent momentum.

    The long-term strategy remains tied to Ethereum Classic’s proof-of-work structure and fixed-supply thesis. It proposes staggered purchases below USD 8.00 while recognizing the asset’s steep annual decline. A conservative approach calls for staying out of the market because ETC carries annualized volatility of 61.6%. This volatility remains relevant as the asset trades after a rapid multi-day advance. USD 9.29 now marks the immediate price level to watch as traders assess whether momentum can continue.

  • XRP Jumps 4% to $1.60 as Binance Reserves Hit Three-Month Peak

    XRP Jumps 4% to $1.60 as Binance Reserves Hit Three-Month Peak

    XRP has rallied 4.4% over the past 24 hours to trade near $1.60, outpacing Bitcoin and the broader cryptocurrency market. The move comes as trading volume jumped to $7.67 billion and Binance XRP reserves reached their highest level in three months.

    Altcoin Strength Fuels XRP Rally

    While Bitcoin gained just 0.05% and the overall crypto market rose 0.56%, XRP climbed 4.40% in the same period. The token also gained 24.52% over the past seven days, breaking out of a multi-week consolidation range.

    CoinMarketCap’s Altcoin Season Index rose 54.55% over the past week to 52, signaling broader strength among altcoins relative to Bitcoin. However, the index remains below the 75 threshold that officially marks an “altcoin season.”

    XRP’s daily trading volume surged 8.57% to $7.67 billion, according to CoinMarketCap live data. Prices may vary slightly across exchanges as trading continues.

    Analyst Sets $10 XRP Target

    Crypto commentator Ash Crypto posted on X that he is “aiming for USD 10” for XRP, calling the current market the start of the “biggest bull run in crypto history.” His post also projected targets of $250,000 for Bitcoin, $10,000 for Ethereum, and $1,000 for Solana.

    No timeframe was provided for these targets. For XRP to reach $10 from $1.60, it would require a 525% increase, far above the token’s immediate resistance levels.

    Key Support and Resistance Levels

    Traders are currently monitoring $1.55 as support and $1.70 as resistance. A daily close above $1.65 could bring $1.70 into play, while a drop below $1.55 would shift focus to $1.45. These levels outline possible trading scenarios rather than guaranteed outcomes.

    Binance Reserves at Three-Month High

    XRP reserves on Binance have risen to approximately 2.68 billion tokens, the highest level since June. According to a CryptoQuant analysis by Arab Chain, higher reserves mean more XRP is available within the exchange’s trading system, but this alone does not indicate selling intent.

    A separate CryptoQuant analysis found that average daily XRP deposits on Binance ran 663% above their quarterly baseline in recent sessions. Withdrawals also increased, leaving reserves only about 0.22% above that baseline. This suggests heavy two-way trading activity rather than a sustained buildup.

    XRP’s next move will likely depend on whether buying pressure continues as the price tests nearby resistance. Holding above $1.55 keeps $1.70 in focus, while losing that support would weaken the recent advance.

  • Bitcoin Bull Score Hits 80 as BTC Reclaims Key $83K Moving Average

    Bitcoin Bull Score Hits 80 as BTC Reclaims Key $83K Moving Average

    Bitcoin has climbed back above USD 80,000 with stronger market fundamentals than it showed during a similar price move in May. According to CryptoQuant, its Bull Score Index now stands at 80, a reading the firm describes as “Extra Bullish.”

    Bull Score Index Jumps to 80

    CryptoQuant Head of Research Julio Moreno said the firm’s Bull Score Index has reached 80, signaling a marked improvement in market conditions. When Bitcoin last traded near the same price in May, the index sat at 50, which corresponds to a “Neutral” reading.

    The Bull Score Index combines multiple market and on-chain signals into a single broader assessment of Bitcoin’s health. The jump from 50 to 80 highlights a clear shift in the underlying fundamentals between the two periods.

    Technical Reclaim and Price Action

    Bitcoin is up 14% over the past week and recently touched a seven-month high near USD 87,000. The rally has pushed the price above major long-term technical levels. CryptoQuant founder Ki Young Ju noted that Bitcoin has reclaimed its 365-day moving average near USD 83,000 and moved above USD 84,000.

    That long-term average is closely watched by market participants as a broad indicator of cycle conditions. Ju described the level as a key dividing line between bearish and bullish phases.

    On-Chain Metrics Reveal Stronger Holder Position

    Ju highlighted the market-value-to-realized-value (MVRV) ratio as another encouraging signal. MVRV compares Bitcoin’s market capitalization with its realized capitalization, which values each coin at the price when it last moved on-chain.

    Importantly, Ju said MVRV never fell below one during the current cycle, even during deep drawdowns. Previous bear-market bottoms saw more severe losses and stronger signs of capitulation among holders.

    Another model, the Profit and Loss (PnL) Index, also paints a healthier picture. That index combines MVRV, net unrealized profit and loss, and other profitability metrics. According to Ju, the PnL Index now shows less extreme cycle tops and bottoms, with bottom formations occurring at progressively higher levels of aggregate holder profitability. The 365-day moving average of the PnL Index has reached what he called a “meaningful inflection” point.

    ETF Inflows and Institutional Activity

    The improved sentiment extends beyond on-chain data. US spot Bitcoin exchange-traded funds recorded USD 998.95 million in inflows on Monday, their strongest single-day total in 11 months. Additionally, Strategy Inc. resumed buying Bitcoin after a pause of nearly a month.

    Regulatory momentum has also contributed to the positive backdrop. The US Securities and Exchange Commission has advanced its efforts to develop a regulatory framework for cryptocurrencies, which has helped lift overall market sentiment.

    Cycle Expectations Shift as Market Matures

    Despite the bullish signals, CryptoQuant’s Ju warns that Bitcoin’s growing size changes how much fresh capital is needed to drive similar percentage gains. He estimates that the current cycle has seen about USD 697 billion in realized-cap growth accompanying a 689% Bitcoin gain. In contrast, Bitcoin’s early years saw roughly USD 2.7 billion generate gains of over 55,000%.

    Ju now expects the current bull cycle to produce gains of about three to five times rather than another move above ten times. He also anticipates that any subsequent bear market will be milder than previous downturns, citing Bitcoin’s larger valuation and increased institutional ownership, which reduce the price impact of each new dollar entering the market.

    Looking Ahead

    Bitcoin’s Bull Score Index has risen to 80 as the asset reclaims its 365-day moving average near USD 83,000. Strong ETF inflows, positive MVRV readings, and higher holder profitability all distinguish the current setup from May. Yet the central question remains whether improving on-chain conditions can sustain the rally as Bitcoin’s larger valuation demands ever-greater capital inflows.

  • XRP Market Cap Crosses $100B as XRPL Permission Upgrade Enters Countdown

    XRP Market Cap Crosses $100B as XRPL Permission Upgrade Enters Countdown

    XRP has regained the $100 billion market cap milestone after a sharp 24-hour rally, while the XRP Ledger (XRPL) moves one step closer to activating a major new feature. Data from CoinGecko shows XRP rose 8% in the latest session, with the token testing resistance near $1.65 amid expanded trading activity.

    Market-Wide Crypto Strength

    The move placed XRP among the top performers in the broader cryptocurrency market. Other assets including Arbitrum, Flare, and Zcash also recorded meaningful gains during the same trading period.

    Even with the latest surge, XRP remains more than 55% below its all-time high from nearly a year ago. The gap underscores how much ground the token still needs to cover to regain its previous peak.

    Trader Peter Brandt has suggested XRP could eventually reach $5.40. Meanwhile, Coinbase data indicates that expected volatility around XRP has risen in recent sessions.

    ETF Inflows and Whale Activity Pick Up

    US spot XRP ETFs recorded $13.03 million in net inflows on September 22, according to CoinGlass. That followed a day with zero net inflows. Total cumulative inflows across those funds now stand at roughly $936.66 million.

    One fund accounted for about $12.47 million of the September 22 total, or around 95.7% of the day’s net buying, signaling that a single product drove most of the demand.

    On-chain data also points to rising activity. Santiment logged 1,917 XRP transactions worth at least $100,000 on Tuesday, the highest one-month count. The XRP Ledger added 3,647 new wallets during the same stretch.

    Notably, the burst in high-value transfers came while XRP was rallying, not during a selloff. That timing sets the current increase apart from the large transfers that often accompany market declines.

    XRPL Permission Upgrade Moves Toward October Activation

    The PermissionDelegationV1_1 amendment entered a 14-day activation countdown on September 21 after 29 of the XRP Ledger’s 35 trusted validators voiced support. If that support is maintained, the amendment could activate on October 5 at 11:18 UTC.

    The feature must keep the backing of at least 80% of validators, meaning 28 or more validators must stay supportive during the countdown. If support falls below that level, the activation clock resets.

    When active, the protocol will allow one XRPL account to grant limited authority to another account without giving up control of the primary keys. For example, a stablecoin issuer could authorize a compliance system to approve customers, while keeping its main keys offline.

    Another operations account could receive permission to process payments, but it would not be able to change keys or transfer permissions to a third party. Each delegated account can receive up to 10 permissions, and the main account can later modify or revoke them.

    This design mirrors traditional banking controls, where payment, compliance, and other functions run under separate authority structures.

    Revised Upgrade Follows Earlier Security Flaw

    PermissionDelegationV1_1 is the second attempt to introduce delegated permissions on the XRP Ledger. The original version contained a vulnerability that could have allowed an attacker to force another account to pay transaction fees without a valid signature.

    Repeated transactions with deliberately high fees could have drained a victim’s XRP balance. The issue stemmed from the order in which the software validated transactions: account permissions were checked before the system verified whether a signature was valid.

    As a result, some failed transactions could still charge fees before the invalid signature was detected. A community tester found the flaw on September 15, 2025, while testing outside the main network.

    Validators were told to reject the original amendment, and it never reached activation. The revised PermissionDelegationV1_1 proposal has now gathered enough initial support to start the countdown, but it still needs sustained validator backing through October 5 to become active.

  • Uniswap (UNI) Surges Past $10 as Whale Accumulation and CME Futures Launch Fuel Rally

    Uniswap (UNI) Surges Past $10 as Whale Accumulation and CME Futures Launch Fuel Rally

    Uniswap (UNI) has broken above a year-long consolidation base, surging more than 15% past the $10 mark. The rally is driven by significant whale buying and CME Group’s announcement of regulated Uniswap futures, set to launch on October 19.

    Tracked whale wallets have accumulated nearly $4 million worth of UNI through on-chain transactions, coinciding with the breakout. Meanwhile, CME Group confirmed plans to introduce standard and Micro Uniswap futures, pending regulatory review. The standard contract will represent 10,000 UNI, while the Micro contract will cover 1,000 UNI.

    The technical breakout broke through a rounding-bottom formation that had contained price action for months. The next key resistance level sits at $12.0532, while $9.2734 remains crucial support that buyers must defend if the rally retraces.

    Whale buying occurred through identifiable wallet activity rather than exchange order flow, reinforcing the strength of the move. The breakout followed a period of consolidation, not a single-session spike, adding technical credibility to the rally.

    CME Group’s expansion into Uniswap futures is part of a broader push into altcoin derivatives. The exchange reported average daily crypto futures and options volume of 279,800 contracts in the first half of 2026, representing $8.3 billion in notional value. Altcoin futures for Cardano, Chainlink, Stellar, Avalanche, and Sui have collectively generated over $1 billion in year-to-date notional volume.

    Giovanni Vicioso, CME Group’s Global Head of Cryptocurrency Products, noted that market participants increasingly need regulated tools for managing digital-asset price risk. The new contracts will trade on Globex, with around-the-clock cryptocurrency trading available since May 29.

    Bitcoin Cash (BCH) also reacted sharply to the announcement, climbing from $270 to $328 on Binance within 90 minutes. UNI traders are now watching the $12.0532 resistance and $9.2734 support levels closely.

  • Solana’s Alpenglow Consensus Upgrade Reaches Public Testnet With 150ms Finality Target

    Solana’s Alpenglow Consensus Upgrade Reaches Public Testnet With 150ms Finality Target

    Solana has advanced its Alpenglow consensus upgrade to the threshold of public testnet deployment, giving developers and validators a broader environment to test a major shift in transaction finality. The upgrade is designed to cut finality time from roughly 13 seconds to about 150 milliseconds.

    What Alpenglow Changes

    Solana currently relies on TowerBFT, a consensus mechanism that requires validators to record votes on-chain. Under TowerBFT, validators must accumulate enough votes across 32 slots before a block is considered final. Alpenglow replaces this with a new protocol called Votor, which lets validators exchange votes directly rather than depending on the same on-chain voting sequence.

    With Votor, agreement can be reached in one or two voting rounds. One round can finalize a block when sufficient validator stake participates; a second round offers an alternative path when participation is lower. Anza estimates median finality near 150 milliseconds, with earlier simulations reaching about 100 milliseconds under favorable conditions.

    From an application or wallet perspective, the upgrade is designed to be mostly invisible. Transactions continue through the same interfaces; the notable changes take place in validator communication and consensus.

    Expanding Testing to Public Testnet

    Alpenglow has been running for more than four months on a smaller community cluster built specifically for consensus testing. Moving to Solana’s public testnet brings more validators and infrastructure providers into the evaluation process. Because testnet tokens hold no real-world value, developers can restart the network, inspect failures, and test migration procedures without risking mainnet assets.

    Anza first moved Alpenglow into community validator testing in May, describing it as the largest consensus change in Solana’s history. Validators participating in the test are expected to run Agave 4.3, the latest branch of Anza’s validator software.

    Agave 4.3 and Mainnet Timeline

    Anza recommended Agave 4.3 for broader mainnet validator adoption on September 21. The rollout initially targeted operators representing 10% of mainnet stake, and the recommendation later expanded to 25%. By August, developers expected the 150-millisecond finality improvement to arrive through Agave 4.3.

    Anza’s schedule lists September 28 as a tentative date for resuming mainnet feature activation, though the date is subject to change. That date should not be read as confirmation that Alpenglow will activate on Solana mainnet. As of early Wednesday, Anza’s feature gate tracker still listed Alpenglow testnet activation as pending.

    Finality is a separate measure from other performance upgrades. Solana recently reduced its target slot time from 300 milliseconds to 250 milliseconds via SIMD-0525, bringing the network to four slots per second. That change also shortened each validator’s four-slot leader window from 1.2 seconds to one second. SIMD-0525 ultimately targets 200-millisecond slots, or five slots per second, but no confirmed mainnet activation date has been announced for that stage.

    Alpenglow follows a separate process through SIMD-0326. Rather than shortening slots, it replaces TowerBFT with Votor and changes how validators agree that blocks have reached finality.

  • MoonPay Bolsters Tokenized Asset Strategy With $60M All-Stock North Capital Acquisition

    MoonPay Bolsters Tokenized Asset Strategy With $60M All-Stock North Capital Acquisition

    Cryptocurrency payments company MoonPay is expanding beyond digital asset payments with an all-stock acquisition of North Capital, a private-markets investment platform, in a deal valued at more than $60 million. The transaction, announced Wednesday, is pending regulatory approval.

    North Capital to Operate as MoonPay Subsidiary

    Once the deal closes, Salt Lake City-based North Capital will become a wholly owned subsidiary of MoonPay. The platform has processed about $9 billion in combined primary and secondary transaction volume.

    North Capital supplies technology infrastructure for private securities issuers and fund managers, covering capital raising, asset management, clearing, custody, and secondary trading. Its affiliates also hold broker-dealer, trading, transfer, and investment advisory registrations with the U.S. Securities and Exchange Commission (SEC).

    MoonPay said the acquisition will add North Capital’s securities tokenization infrastructure and regulatory capabilities to its existing payments and tokenization stack.

    Why MoonPay Is Buying North Capital

    The deal supports MoonPay’s focus on tokenized real-world assets (RWAs). MoonPay CEO Ivan Soto-Wright said the acquisition will help create the regulatory foundation needed for wider adoption of tokenized RWAs.

    “We believe bringing those capabilities into the MoonPay ecosystem can help connect different parts of the financial system through modern, programmable infrastructure,” Soto-Wright said.

    Tokenization converts real-world assets such as equities, bonds, and commodities into blockchain-based tokens that can be bought, sold, and traded on distributed ledgers.

    MoonPay’s Push Beyond Crypto Payments

    The purchase is the latest step in MoonPay’s move beyond its core cryptocurrency payments business. The company’s Trade platform connects banks and fintech companies with tokenized assets, decentralized finance (DeFi) protocols, and stablecoin liquidity.

    Earlier this year, MoonPay also acquired Solana-based trading infrastructure provider DFlow and security startup Sodot. The North Capital deal adds another layer to its push into tokenized assets, a growing blockchain use case among traditional financial institutions.

  • Bitcoin Mining Pool Data: What Actually Drives Performance and Payouts

    Bitcoin Mining Pool Data: What Actually Drives Performance and Payouts

    The Metrics Behind Mining Pool Profitability

    Bitcoin mining pool choices are often shaped by reputation or habit rather than measurable performance. Yet as network difficulty climbs and hashrate distribution shifts, the operational quality of a pool has a direct impact on daily earnings. Looking at the data reveals a consistent set of patterns that separate high-performing pools from the rest.

    Uptime Claims Need a Closer Look

    A pool advertising 99% uptime still leaves about 3.65 days of downtime per year. For operations running thousands of ASICs, even a few hours of downtime during a period of high network difficulty can lead to a meaningful drop in block rewards relative to contributed hash power. Pools that consistently perform well in profitability comparisons tend to report uptime figures above 99.9%, not just 99%. That extra decimal point represents real earnings.

    Latency Directly Affects Earnings

    Share submission latency is the time between an ASIC finding a share and the pool registering it. High latency does not just create a laggy dashboard experience; it can result in stale shares that do not count toward payouts at all. Pools processing shares in the 80–120 ms range consistently outperform pools with multi-second lag, even when both claim similar theoretical hashrates.

    Payout Methods Change the Risk Profile

    PPS, FPPS, PPLNS, and PROP distribute rewards differently. PPS offers predictable, immediate payouts by shifting variance risk onto the pool operator. PPLNS ties payouts more closely to blocks actually found, which can mean higher long-term returns but choppier short-term earnings. Miners comparing profitability calculators without factoring in payout structure are often looking at numbers that are not truly comparable.

    The Hidden Efficiency Drain: Stale Shares

    Stale shares are solved against outdated jobs and directly reduce effective hash power. A pool maintaining a stale share rate below 0.2% during peak load is operating at a different infrastructure tier than one that does not publish or track this metric at all.

    Why Infrastructure Quality Matters Most

    The technical difference between a mining pool that scales cleanly to industrial hashrates and one that buckles under load usually comes down to architecture. This includes how the Stratum protocol handles concurrent connections, whether payout logic scales independently from data ingestion, and whether monitoring is built in from day one instead of added after problems surface.

    One industrial-scale example, Red Rock Pool, reached roughly 2 EH/s of hashrate in its first month, connected more than 10,000 ASIC devices, maintained uptime above 99.9%, kept average latency between 80 and 120 ms, and held its stale share rate under 0.2%. Those results did not come from adding more hardware; they came from architecture designed to handle that scale from the start.

    How to Read Pool Statistics With the Right Filter

    • What is the actual uptime figure, not the rounded marketing number?
    • What payout method is used, and does it match the miner’s tolerance for variance?
    • What is the reported share submission latency during peak network activity?
    • Is the stale share rate or similar processing efficiency data published at all?

    Pools that answer these questions with real operational data are more likely to be built for scale than pools that rely on vague claims.

    The Bottom Line

    Hash price, electricity costs, and difficulty adjustment are all important to Bitcoin mining profitability. But pool selection is one variable miners can control. The data consistently show that infrastructure quality, not marketing claims, determines whether hash power converts into earnings at the rate it should.

    This article is for informational purposes only and does not constitute financial advice. Always conduct your own research before making investment decisions.