Category: Finance

  • India Proposes MDR on UPI Transactions Above Rs 2,000: What It Means for Users

    India Proposes MDR on UPI Transactions Above Rs 2,000: What It Means for Users

    India’s Unified Payments Interface (UPI) has transformed digital payments by offering free transactions, but it could soon see a major policy shift. The central government has proposed amendments to the Payment and Settlement Systems Act, 2007, allowing banks and payment service providers to charge a Merchant Discount Rate (MDR) on select UPI transactions in the future.

    The final decision is pending, but the proposal suggests an MDR of 0.25% to 0.4% for merchant UPI transactions above Rs 2,000, while person-to-person (P2P) transfers would remain free. Government officials have not set a timeline for implementation.

    Impact on High-Value Transactions

    MDR is a fee merchants pay to banks and payment service providers for processing digital payments. Unlike UPI, credit and debit card payments already include MDR, typically borne by the merchant rather than the customer.

    According to official estimates, only 5% of all UPI transactions exceed the proposed Rs 2,000 threshold. However, these high-value transactions account for nearly 65% of total transaction value, presenting a significant revenue opportunity for the payments ecosystem.

    UPI continues to grow rapidly, facilitating approximately 23.7 billion transactions worth Rs 29.9 lakh crore, cementing its status as one of the world’s largest real-time payment networks.

    An official explained the limited consumer impact: “Even if implemented, 95% of transactions will not face the merchant discount rate. Besides, not all businesses will pass on the fees, which will be a small amount.”

    Long-Term Industry Prospects

    Industry executives believe allowing a limited MDR on high-value merchant transactions could create a more sustainable business model for payment companies. Since UPI currently generates little direct transaction revenue, banks and payment providers argue that additional income would fund technology upgrades, improve payment infrastructure, and support future innovation.

    According to Jefferies’ analysis, merchant UPI transactions above Rs 2,000 represent roughly 67% of merchant payment value despite accounting for only about 4% of transaction volume. The brokerage estimates that introducing MDR for this segment could generate Rs 5,000 crore to Rs 10,000 crore in annual revenue for the digital payments industry, potentially benefiting companies like Paytm and Pine Labs.

    Industry sources expect the government to introduce a cap on the maximum fee charged. As one source noted, “Unlike credit cards, there is no funding cost involved, so it makes sense to have a ceiling once the costs are covered.”

    For now, the proposed amendment only creates the legal framework to enable MDR. The government has not confirmed whether merchant charges will be introduced, what the final rates will be, or when such a policy could take effect. Until then, UPI transactions remain free under the existing system.


  • Central Banks Accelerate Gold Purchases in 2026: Diversification, De-Dollarization, and Geopolitical Stability Drive Record Demand

    Central Banks Accelerate Gold Purchases in 2026: Diversification, De-Dollarization, and Geopolitical Stability Drive Record Demand

    Central banks worldwide continue to increase their gold reserves in 2026, signaling a major shift in how reserve managers protect national wealth. Gold is no longer merely a traditional safe asset; it is now viewed as a strategic reserve that bolsters financial stability during periods of global uncertainty.

    Key Takeaways

    • Central banks view gold as a strategic reserve that strengthens financial resilience during global uncertainty.
    • Diversification away from the US dollar is driving long-term growth in official gold holdings.
    • Strong central bank demand continues despite record gold prices, supporting the metal’s long-term outlook.

    Countries Look Beyond the US Dollar

    Many central banks now aim to reduce heavy reliance on a single reserve currency. Gold offers a valuable alternative since no government or financial institution controls its value. This feature gives central banks greater flexibility during periods of political or economic stress.

    Reserve managers also seek stronger protection against financial sanctions and changing global alliances. These concerns encourage many countries to expand gold reserves while keeping a balanced mix of reserve assets. The World Gold Council survey shows that many reserve managers expect the share of US dollar reserves to decline over the coming years while gold gains a larger role.

    Geopolitical Tensions Support Gold Demand

    Global conflicts and rising political tensions continue to shape reserve strategies in 2026. Trade disputes, regional wars, sanctions, and diplomatic disagreements create uncertainty across financial markets. Gold remains attractive during such periods since it carries no credit risk and no foreign issuer controls it.

    Central banks value this independence and continue to strengthen national reserves with additional gold. Analysts also expect geopolitical risks to remain one of the strongest long-term factors that support official gold demand.

    Gold Adds Balance to Reserve Portfolios

    Central banks usually hold foreign currencies, government bonds, and other financial assets. Gold adds another layer of protection that works differently from these traditional reserves. Government bonds depend on fiscal policy, interest rates, and currency performance. Gold often follows a different path during market stress, which helps create a more balanced reserve portfolio. This diversification reduces overall financial risk and improves reserve strength during uncertain periods.

    Rising Debt Raises Fresh Concerns

    Government debt continues to expand across many large economies. Higher debt levels create concerns about long-term fiscal stability and the future value of paper currencies. Central banks respond by increasing exposure to assets that carry no liability from another country. Gold fits this requirement since it exists as a physical reserve asset with lasting value. This quality makes gold an important part of long-term reserve planning as governments face rising borrowing needs and uncertain fiscal conditions.

    Official Purchases Stay Strong Despite High Prices

    Gold prices reached record levels during 2026, yet central banks continued to add more metal to their reserves. The World Gold Council initially estimated official gold purchases at 244 tonnes during the first quarter of 2026. It later revised the estimate to 57 tonnes following updates to reporting methodology and data classification. Poland and Uzbekistan led reported purchases during the quarter, while China also continued steady accumulation.

    Later analysis revised the first-quarter estimate to 57 tonnes after changes in data classification and reporting methods. The revised figures also showed that central banks and sovereign wealth funds purchased about 345 tonnes during the first half of 2026, which marked the lowest six-month total since 2022. Even with this revision, analysts still describe central banks as dependable long-term buyers that continue to support the gold market through structural demand rather than short-term market movements.

    Confidence in Gold Remains High

    Gold also strengthens confidence in a country’s financial position. Large gold reserves signal strong reserve quality and improve trust in national balance sheets. Many central banks now store more gold within their own borders to strengthen control over strategic reserves. This approach reflects a wider effort to improve financial resilience during uncertain times. Gold also offers high liquidity, which allows central banks to access value quickly whenever financial markets face stress.

    Why This Matters

    The gold reserves of central banks are major contributors to global financial stability, currency confidence, and investment patterns. The increase in official demand showcases a big change in the management of reserves and priorities in the global economy. This development influences gold prices, foreign reserves, and other financial markets.

    Gold Will Remain a Strategic Reserve Asset

    Central bank demand for gold reflects long-term planning rather than short-term price movements. Reserve managers continue to value gold for its independence, liquidity, stability, and ability to strengthen national reserves. Recent revisions in quarterly purchase data highlight the difficulty of tracking official buying rather than any loss of confidence in gold. The latest surveys, market data, and analyst views all point toward one clear conclusion: Gold will continue to hold a central place in global reserve management as countries prepare for a more uncertain financial and geopolitical landscape.

    FAQs

    1. Why are central banks buying more gold in 2026? They are increasing gold reserves to diversify assets, reduce reliance on the US dollar, and strengthen financial stability amid geopolitical and economic uncertainty.
    2. Does higher gold buying mean countries are abandoning the US dollar? Not entirely. Most central banks are diversifying their reserves rather than replacing the dollar completely.
    3. Why is gold considered a strategic reserve asset? Gold has no credit risk, is highly liquid, retains long-term value, and is not controlled by any single government.
    4. Are central banks still buying gold despite record prices? Yes. Although first-quarter estimates were revised, central banks remain consistent long-term buyers driven by strategic objectives rather than short-term price movements.
    5. How does central bank gold buying affect investors? Strong official demand can support long-term gold prices and reinforces gold’s role as a safe-haven asset during periods of market uncertainty.
  • Wall Street Rises as Oil Prices Drop and Amazon Hits $3 Trillion Market Cap

    Wall Street Rises as Oil Prices Drop and Amazon Hits $3 Trillion Market Cap

    Wall Street opened August with broad gains on Monday as lower oil prices eased pressure across major sectors. Investors responded to signs that Washington may avoid fresh strikes against Iran, though Tehran denied that formal talks had started.

    The Dow led the early advance, while the S&P 500 and NASDAQ also moved higher. Amazon reached a $3 trillion market value. Investors also reviewed strong manufacturing data and prepared for a busy earnings week.

    Oil Slide Lifts Wall Street Sentiment

    The Dow Jones Industrial Average rose 604.70 points, or 1.15%, to 53,089 at 9:35 a.m. ET. The S&P 500 gained 1.2% to 7,585. The NASDAQ Composite added 1.97% to 25,872.

    Seven of the 11 S&P 500 sectors traded higher, with communication services leading. Energy shares lagged as crude prices fell. Advancing stocks outnumbered decliners by 1.89-to-1 on the NYSE and 1.49-to-1 on NASDAQ, showing broad early participation.

    President Donald Trump said planned talks would address Iran and the reopening of the Strait of Hormuz. He also canceled a planned attack on Iran. Tehran rejected his account and said no talks or meetings were scheduled. Brent crude fell 5% to below $84 per barrel. West Texas Intermediate dropped 6.1% to below $80.

    Amazon Reaches $3 Trillion Value

    Amazon shares climbed 5% in early trading, pushing the company’s market value above $3 trillion. The move followed its latest earnings report and extended gains from the previous week. Most large technology and growth stocks also advanced during the opening session.

    Software stocks supported the technology sector, with Microsoft and Salesforce moving higher. Chipmakers moved in the opposite direction. The Philadelphia Semiconductor Index fell 2.8% after a difficult July. Micron also dropped 3.4% after a report said China’s CXMT may build another memory-chip plant in Beijing.

    Earnings Calendar Draws Attention

    SpaceX will release its first quarterly results since its public listing on Tuesday. Its shares rose nearly 3% to trade near 111.57 at press time. Investors will track Starlink growth, launch revenue, and updates on the Starship program. Other technology companies reporting this week include Palantir, AMD, SanDisk, and Western Digital.

    “The on-again, off-again nature of US-Iran diplomacy could mean earnings and jobs data will have to do the heavy lifting for the bulls this week,” said Chris Larkin of E*TRADE. Company reports will also shape trading after July’s volatility around artificial intelligence spending, interest rates, and the Middle East conflict.

    Drug Merger Report Moves Shares

    Bristol Myers Squibb gained 1.5% after reports of preliminary merger discussions with AstraZeneca. A possible combination could create a pharmaceutical company worth nearly $400 billion. Reuters could not confirm whether the discussions remained active.

    Both companies hold large cancer-drug businesses, which could draw close regulatory review. Oncology products generated more than 40% of Bristol Myers’ sales during the first half of 2026. AstraZeneca also receives a large share of its revenue from cancer treatments.

    Factory Data and Fed Policy in Focus

    US manufacturing activity rose to its highest level since May 2022. The ISM manufacturing index reached 55.6 in July, up from 53.3 in June. Economists expected a reading of 54.0. Factory employment rose to 52.8, its first expansion reading in 33 months. Input prices eased to 71.1 but stayed elevated.

    New York Fed President John Williams said he expects inflation to cool during the second half of 2026. He said current interest-rate policy remains ‘well positioned.’ However, he said the Fed could raise rates if inflation fails to move toward 2%. The central bank kept its target range at 3.50% to 3.75% last week. Investors will next review several labor reports, including Friday’s nonfarm payrolls release.

    Disclaimer: This article is for informational purposes only and does not constitute investment advice. Always conduct your own research before making financial decisions.

  • Why Warren Buffett Touts Low-Cost S&P 500 ETFs as the Ultimate Wealth Builder

    Why Warren Buffett Touts Low-Cost S&P 500 ETFs as the Ultimate Wealth Builder

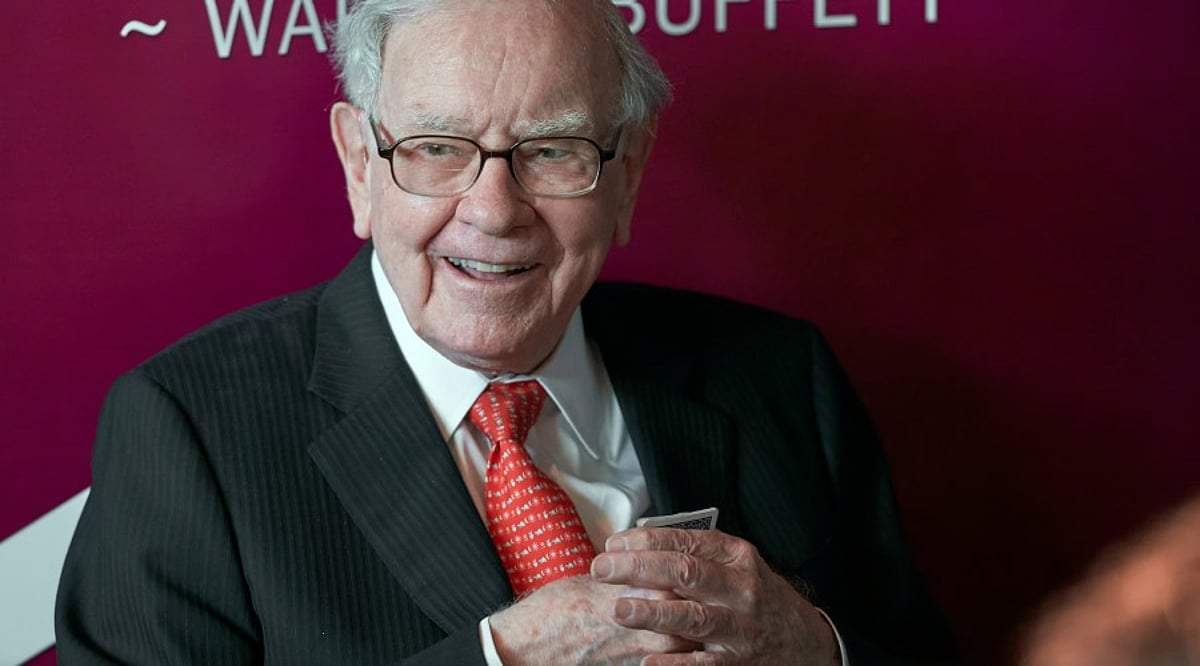
    Warren Buffett, one of the world’s most successful investors, has long advised the average investor to follow a simple investment strategy: invest in a low-cost S&P 500 index fund and hold it for the long term. Contrary to the idea that Buffett invests only in individual stocks, he believes most retail investors are better served by passive investing rather than trying to outperform the market.

    His insights have become especially relevant as exchange-traded funds (ETFs) continue to attract record inflows from investors seeking diversified, low-cost exposure to the US stock market.

    The Simple Investment Philosophy of Buffett

    Buffett has repeatedly said that most investors don’t need to research individual companies or try to beat professional managers. Instead, he recommends purchasing a low-cost S&P 500 index fund, which holds 500 of the largest publicly traded US companies. During Berkshire Hathaway’s annual meeting, he stated, “For most people, the best thing to do is to own the S&P 500 index fund.”

    His confidence is backed by a famous 2008 bet: Buffett wagered $1 million that an S&P 500 index fund would outperform a portfolio of five hedge funds over 10 years. The result was decisive—the S&P 500 delivered roughly 126% returns, while the hedge funds managed only about 36%.

    Why Low-Cost ETFs Stand Out

    Buffett frequently highlights the Vanguard S&P 500 ETF (VOO), which carries an expense ratio of just 0.03%—one of the lowest available. Over the past 10 years (as of late July 2026), VOO has generated a total return of about 303%. The ETF also provides instant diversification across sectors like technology, healthcare, financial services, consumer goods, energy, and industrials, reducing the risk of owning just a few stocks.

    The Power of Long-Term Compounding

    Buffett’s core rule is to let compound returns work. The S&P 500 has historically averaged about 10% annual returns over long periods, though yearly results vary. Disciplined investing and reinvestment in an S&P 500 ETF could grow an initial sum to over $1 million after 40 years, based on historical averages. Market analysts note that the S&P 500 has delivered positive total returns over every rolling 20-year period since 1919, underscoring the benefit of staying invested through market cycles.

    Why Buffett Prefers Passive Investing

    Despite decades of beating the market, Buffett admits it is extremely difficult to do so consistently. Most actively managed funds underperform the S&P 500 over the long term after expenses. That’s why Buffett has publicly stated he would invest 90% of his wife’s cash inheritance into a low-cost S&P 500 index fund and the remaining 10% into short-term government securities.

    Conclusion

    Buffett’s investment advice remains consistent: value low costs, diversify, invest regularly, and hold for the long term. For most people, a low-cost S&P 500 ETF offers a simple and proven path to building wealth. While advanced investors may succeed with individual stocks, Buffett’s passive investing mantra continues to be one of the most straightforward ways to achieve long-term financial security.

    Frequently Asked Questions

    1. Why does Warren Buffett recommend S&P 500 index funds? Buffett believes most investors cannot consistently beat the market. A low-cost S&P 500 index fund provides broad diversification, low fees, and long-term exposure to America’s largest companies.
    2. Which ETF does Warren Buffett recommend? Buffett has frequently highlighted the Vanguard S&P 500 ETF (VOO) because of its extremely low expense ratio, broad market exposure, and strong long-term performance.
    3. Are S&P 500 ETFs suitable for beginners? Yes. They offer instant diversification, passive management, and historically strong long-term returns, making them one of the simplest investment options for beginners.
    4. What is the biggest advantage of investing in an S&P 500 ETF? The biggest benefit is long-term wealth creation through diversification and compound growth, without the need to research or actively manage individual stocks.
    5. Can an S&P 500 ETF guarantee positive returns? No. Like all equity investments, S&P 500 ETFs can decline over shorter periods. However, history shows they have delivered strong returns over long investment horizons, making them popular among long-term investors.
  • 25 Best Dividend Stocks to Buy in August 2026: Undervalued Opportunities for Income Investors

    25 Best Dividend Stocks to Buy in August 2026: Undervalued Opportunities for Income Investors

    Dividend-paying stocks remain one of the most reliable ways to generate passive income and build long-term wealth. In August 2026, several high-quality dividend stocks appear undervalued based on metrics such as Dividend Yield Theory (DYT), Free Cash Flow (FCF), and historical Price-to-Earnings (P/E) ratios. Below is a curated list of the top 25 dividend opportunities, along with key valuation insights.

    Top 25 Dividend Stock Opportunities for August 2026

    1. Broadridge Financial (BR) – Trading at ~14x P/FCF, Broadridge offers an attractive valuation with a strong, consistent dividend growth record.
    2. Zoetis (ZTS) – Undervalued by 61% according to DYT, trading below 16x forward P/FCF, making it a compelling long-term buy.
    3. Accenture (ACN) – Despite a July rally, Accenture remains one of the cheapest large-cap tech consulting stocks at 8x forward earnings.
    4. Blackstone (BX) – Moderately undervalued; FCF is less relevant for alternative asset managers, so focus on dividend yield.
    5. SBA Communications (SBAC) – A REIT with recurring cash flows, trading at a P/E of 39.86 and a 2.76% annual dividend.
    6. Paychex (PAYX) – Improving from recent lows, reasonably valued at 18x FCF for a high-quality dividend payer.
    7. Amdocs (DOX) – Discounted by 45–47%, trading at 9x P/FCF – a healthy entry point.
    8. Autoliv (ALV) – Fairly valued with a 10% discount margin based on historical P/E, suggesting moderate upside.
    9. McDonald’s (MCD) – Slightly below historical valuations; DYT indicates moderate upside.
    10. Darden Restaurants (DRI) – Relatively fairly valued with limited valuation potential at current prices.
    11. Penske Automotive Group (PAG) – DYT suggests a 10% discount, but trades at ~30x FCF, making it pricey on cash-flow basis.
    12. PepsiCo (PEP) – Shares undervalued by 28–38% per DYT, trading below 20x FCF.
    13. Thomson Reuters (TRI) – 35–44% undervalued after a big price correction, one of the best software-related opportunities.
    14. NextEra Energy (NEE) – DYT shows a 9% discount, but historical earnings suggest more upside; trades at ~19.5x earnings.
    15. Regions Financial (RF) – Fair value per DYT, but high historical FCF multiple.
    16. Essential Utilities (WTRG) – Slight discount, though 20x earnings multiple is above long-term market averages.
    17. Sysco (SYY) – Fairly priced; historical FCF analysis shows ~27% upside potential.
    18. McCormick (MKC) – Consumer staples standout: 45% discount via DYT, 64% upside per FCF analysis.
    19. Constellation Brands (STZ) – ~47% undervalued, one of the best value stocks on the list.
    20. Toronto-Dominion Bank (TD) – Overpriced after a 2025 surge, per both DYT and historical earnings.
    21. American Water Works (AWK) – Reasonably priced historically, but 25x earnings is high on an absolute basis.
    22. Cohen & Steers (CNS) – Slightly overvalued per DYT and earnings-based analysis.
    23. Bank of Montreal (BMO) – Overvalued after recent run-up based on both DYT and historical earnings.
    24. Fifth Third Bancorp (FITB) – Trading at a premium to dividend yield history and earnings after a strong price rise since 2024.
    25. Cullen/Frost Bankers (CFR) – Trading at about par; 16x earnings is reasonable for a quality regional bank.

    Key Takeaways

    The most attractive dividend stocks on multiple valuation measures include Zoetis, Accenture, Broadridge Financial, Amdocs, McCormick, Constellation Brands, Thomson Reuters, PepsiCo, Paychex, and Sysco. Conversely, several banking stocks (Toronto-Dominion Bank, Bank of Montreal, Fifth Third Bancorp, Regions Financial) appear fairly valued or overpriced. Investors should also consider dividend sustainability, earnings growth, balance sheet strength, and business fundamentals before committing capital.

    Frequently Asked Questions

    1. Which dividend stocks appear most undervalued for August 2026?

    Zoetis, Accenture, Amdocs, McCormick, Constellation Brands, Thomson Reuters, and Broadridge Financial stand out across multiple valuation models. Always verify earnings and dividend growth prospects.

    2. What is Dividend Yield Theory?

    Dividend Yield Theory compares a stock’s current dividend yield with its long-term historical average. A higher-than-usual yield may indicate undervaluation, but could also signal business deterioration or weak dividend growth.

    3. Why is free cash flow important for dividend investors?

    Free cash flow indicates how much cash remains after operating and capital expenses. Companies with consistent free cash flow are better positioned to sustain and grow dividends, repay debt, and invest for the future.

    4. Are all 25 stocks currently attractive buys?

    No. Several names (TD, BMO, FITB, RF) appear fairly valued or expensive. This list is a research starting point, not a buy recommendation.

    5. What should investors check before buying a dividend stock?

    Review payout ratios, dividend growth history, earnings stability, debt levels, cash generation, valuation, and industry outlook. A high yield alone does not guarantee a safe investment.

    Disclaimer: This article is for informational purposes only and does not constitute investment advice. Always conduct your own research before investing. Past performance is not indicative of future results.

  • Indian Stock Market Opens Mixed: Nifty Dips 70 Points, Sensex Gains 395 Points

    Indian Stock Market Opens Mixed: Nifty Dips 70 Points, Sensex Gains 395 Points

    The Indian stock markets opened on a mixed note on Tuesday, following a late sharp rise in the previous session triggered by the launch of the new Closing Auction Session (CAS) framework. The Nifty 50 index opened 70.4 points or 0.28% lower at 24,703.90, while the Bank Nifty started 179 points below the previous close of 58,068.95. In contrast, the Sensex opened higher by approximately 395 points, reaching 79,132.97.

    The Indian rupee opened flat at Rs. 95.36 per dollar against Monday’s close of Rs. 95.34. Foreign institutional investors (FIIs) remained net buyers in Indian equities on August 3, purchasing shares worth Rs. 922.26 crore. Domestic institutional investors (DIIs) also extended their buying activity, investing Rs. 1,571.18 crore during the same period.

    The broader market remained firm, with the Nifty Midcap 100 and Smallcap 100 indices each gaining 1.2%.

    Sensex Outlook

    Technically, the Sensex continues to maintain a positive structure, with the 77,800–77,600 range acting as the immediate support zone. According to Sachin Gupta, VP of Technical Research at Choice Equity Broking, “As long as it holds above this range, the overall trend is expected to remain bullish. On the upside, 78,300–78,500 remains the immediate resistance zone, and a sustained breakout above these levels could trigger the next leg of the rally towards 78,800–79,000.”

    Nifty 50 Outlook

    The Nifty 50 has strengthened its technical structure after breaking out of a three-month consolidation range. The index formed a strong bullish candle on the daily chart while closing above the upper boundary of its recent consolidation range. Analysts believe the breakout above the triangular consolidation pattern suggests the index could extend its rally towards the 25,000–25,200 zone over the coming sessions. Bajaj Broking Research stated, “We believe bias remains positive and dips, if any, in the coming sessions should be used as a buying opportunity. On the downside, immediate support is placed at 24,500–24,400 levels, while key short-term support is placed at the 24,200 levels, being the confluence of the key retracement of the current up move and 20-day EMA.”

    Bank Nifty Outlook

    Bank Nifty also pushed higher, extending its upward momentum and forming a strong bullish candle on the daily chart, closing above the psychologically important 58,000 level. Analysts noted that if there is a decisive breakout over the upper end of the 58,500–58,700 band, it may spark fresh buying interest and open the door for a move toward 59,300 and then 60,000. However, if the index cannot hold above 58,700, then Bank Nifty may keep consolidating inside the 57,000–58,700 area until a clearer breakout happens. On the downside, the 56,500–56,000 zone remains a crucial support area, reinforced by the confluence of the lower band of the six-week trading range, an ascending trendline, and the 52-week EMA, making it a strong demand zone. As long as the index holds above this support cluster, the broader outlook is expected to remain constructive.

    Disclaimer: This article is provided for informational purposes only and does not constitute investment advice. You are responsible for conducting your own research (DYOR) before making any investments. Read more about the financial risks involved here.

  • Global Stock Exchange Trading Hours: A Complete Guide to Major Markets

    Global Stock Exchange Trading Hours: A Complete Guide to Major Markets

    Stock market trading hours vary across countries because of different time zones, regulations, and market practices. Understanding these schedules is essential for investors who trade international stocks, monitor global market movements, or react to overnight economic developments. Knowing when major exchanges open and close helps traders plan investments, execute orders efficiently, and stay updated with global financial trends.

    New York Stock Exchange and Nasdaq

    The New York Stock Exchange (NYSE) and Nasdaq are the world’s largest stock exchanges by market capitalization. Both operate from 9:30 AM to 4:00 PM Eastern Time (ET) on weekdays. They also offer pre-market and after-hours trading sessions, allowing investors to react to earnings announcements, economic data, and breaking news outside regular trading hours.

    London Stock Exchange

    The London Stock Exchange (LSE) is Europe’s leading financial marketplace and operates from 8:00 AM to 4:30 PM Greenwich Mean Time (GMT). It serves companies from around the world and is an important hub for international investors. The exchange also conducts opening and closing auctions that help determine fair market prices and improve trading efficiency.

    Indian Stock Exchanges

    India’s two primary exchanges—the National Stock Exchange (NSE) and Bombay Stock Exchange (BSE)—operate from 9:15 AM to 3:30 PM Indian Standard Time (IST). A pre-opening session begins at 9:00 AM, allowing price discovery before regular trading starts. Both exchanges remain closed on weekends and designated public holidays announced by market regulators.

    Asian Market Trading Hours

    Asia is home to several influential stock exchanges. The Tokyo Stock Exchange (TSE) trades from 9:00 AM to 3:00 PM JST, with a lunch break between sessions. Meanwhile, the Hong Kong Stock Exchange (HKEX) operates from 9:30 AM to 4:00 PM HKT, also including a midday trading break, unlike most Western exchanges.

    How Time Zones Affect Global Investors

    Global investors often monitor multiple exchanges throughout the day because markets open sequentially across different regions. Asian markets begin trading first, followed by European exchanges and finally North American markets. This continuous cycle means economic events in one region can influence investor sentiment and stock prices in another before local markets even open.

    Choosing the Right Time to Trade

    Successful investing isn’t only about selecting the right stocks—it also involves understanding when markets are active. Higher trading volumes during opening and closing hours often create greater price movements and liquidity. By tracking global stock market timings, investors can better manage risk, seize opportunities, and make informed decisions across international financial markets.

  • FTSE 100 Opens 44 Points Higher as US-Iran Peace Hopes Lift Markets; BP and HSBC Earnings Surge

    FTSE 100 Opens 44 Points Higher as US-Iran Peace Hopes Lift Markets; BP and HSBC Earnings Surge

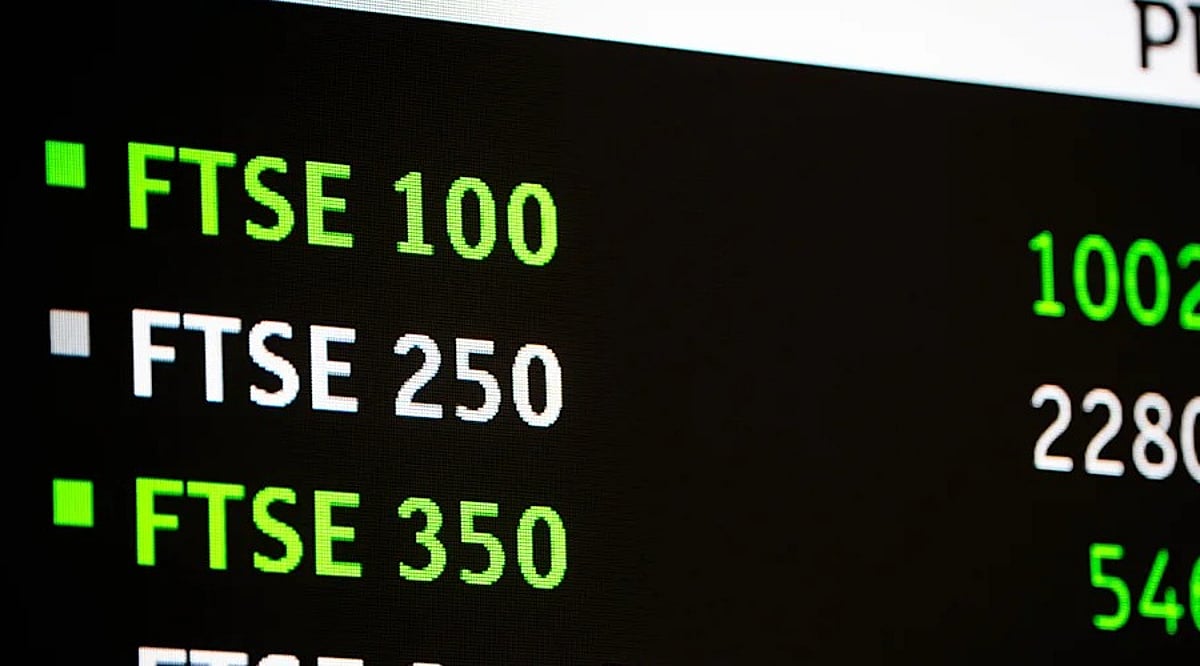
    The FTSE 100 opened 40.58 points higher at 10,898.28 on Tuesday, buoyed by signs of diplomatic engagement between the United States and Iran. The positive sentiment also lifted oil prices, with Brent crude futures rising 1.46% to $84.99 per barrel and US West Texas Intermediate (WTI) gaining 0.70% to $80.90 per barrel.

    Sterling edged lower against the dollar, slipping to $1.3423 from $1.3425 in the previous session, and fell to €1.1664 against the euro from €1.1669.

    Gainers and Losers

    Mining stocks led the gains, with Antofagasta climbing 3.10% to 3,793p. Babcock International Group advanced 2.66% to 1,177p, while BAE Systems also gained 2.66% to 2,200p. Anglo American rose 2.54% to 3,799p, Rio Tinto added 2.30% to 7,252p, and Endeavour Mining increased 2.22% to 3,595p.

    On the downside, Smith & Nephew plunged 5.76% to 1,128p, leading the decliners. Coca-Cola Europacific Partners fell 4.16% to 7,725p, while Admiral Group declined 2.00% to 3,726p. Next slipped 1.24% to 14,715p, Coca-Cola HBC eased 0.94% to 4,838p, and Games Workshop Group edged 0.57% lower to 19,120p.

    BP Doubles Profit

    BP more than doubled its second-quarter profits as higher oil and gas prices and stronger refining margins offset lower production. Underlying replacement cost profit rose to $5.7 billion from $2.4 billion a year earlier and $3.2 billion in the first quarter. Reported profit attributable to shareholders increased to $3.9 billion from $1.6 billion.

    Operating cash flow climbed 73% year-on-year to $10.9 billion, despite a $1 billion working capital build. Net debt was reduced to $22.3 billion from $25.3 billion at the end of March, slightly exceeding guidance.

    HSBC Beats Profit Forecasts

    HSBC announced a fresh $1 billion share buyback after first-half profit rose 23% and beat forecasts. The company reported pre-tax profit of $19.5 billion for the first six months of 2026, up 23% from a year earlier. Profit for the second quarter jumped 60% to $10.1 billion, beating the consensus estimate of $9.51 billion. The jump was flattered by the $2.1 billion Bank of Communications charge taken a year earlier.

    Travis Perkins Cuts Dividend

    Travis Perkins cut its dividend from 4.5p to 4p after the building materials firm warned of a slump in construction and price uncertainty. “The UK construction sector remains subdued with activity levels remaining depressed during the first half,” the company said. “Given wider geopolitical and macroeconomic events, building materials price inflation remains hard to forecast. Against this backdrop, the group remains focused on improving what lies within its control.”

    Travis Perkins posted a 1.8% drop in revenue for the first six months of the year to £2.3 billion. The stock is down 10% since the start of the year.

    Global Market View

    In the US, the Dow Jones rose 1.3%, the S&P 500 climbed 1.5%, and the Nasdaq jumped 2.1%. Lower oil prices, stronger US manufacturing data, and fading concerns about a hawkish Federal Reserve helped the S&P close near its record high.

    In Asia on Tuesday, Tokyo’s Nikkei 225 rose 0.32% to 63,957.53, while China’s Shanghai Composite gained 0.33%. Hong Kong’s Hang Seng declined 0.77%, and South Korea’s Kospi edged higher by 1.62%. In India, both the Nifty 50 and the Sensex fell by 1.18% and 0.39%, respectively.

    Disclaimer: Analytics Insight does not provide financial advice or guidance on cryptocurrencies and stocks. This article is provided for informational purposes only and does not constitute investment advice. Always conduct your own research before making any investments.

  • Fin AI Review: AI-Powered All-in-One Personal Finance App for Budgeting, Investing, and Credit

    Fin AI Review: AI-Powered All-in-One Personal Finance App for Budgeting, Investing, and Credit

    Overview

    Fin AI is a financial management app that leverages artificial intelligence to help users handle budgeting, investing, insurance, credit, and financial planning—all from a single platform. By combining AI-driven insights with regulated financial services, the app simplifies personal finance management and enhances financial literacy.

    Key features include expense tracking, personalized financial insights, investment recommendations, credit monitoring, and an AI-powered assistant. Fin AI offers easy financial planning, intelligent budgeting, secure services, and access to a variety of financial tools.

    General Information

    • Founded: 2025
    • Platform Support: Android
    • Download: Available on Google Play Store

    Main Features

    Fin AI delivers a comprehensive suite of features:

    • AI-powered financial assistant that provides insights on budgeting, investments, credit, insurance, and financial planning through intelligent chat.
    • Budgeting tools, expense tracking, financial health scores, and goal-based planning.
    • Access to mutual funds, bonds, fixed-income investments, retirement plans, and investment education via financial partners.
    • Credit score tracking, personal loans, insurance solutions, tax planning, fraud alerts, and financial calculators.
    • Integrated AI guidance for budgeting, investment, credit, insurance, and planning in one FinTech app.

    Benefits

    • Manage personal finances with AI-driven insights and budgeting.
    • Facilitate financial planning through a single platform for investment, insurance, tax, and retirement information.
    • Make sound financial decisions with personalized scores, planning tools, and educational resources.
    • Secure financial services using encrypted technology and licensed providers.
    • Consolidate multiple financial services into one streamlined management platform.

    Challenges

    • Market risks remain for investments despite AI analysis.
    • Availability of certain financial products and partner offerings may vary based on qualifications and compliance.
    • Internet connectivity is required for AI analysis and online services.
    • AI recommendations should be complemented with personal research.
    • Users must actively plan their finances to maximize the app’s benefits.

    Subscription Information

    Fin AI – All in One Finance is free to download from the Google Play Store. Basic financial planning and AI services are available upon installation. Some financial products and services from partners may require meeting specific conditions.

    Support Options

    Help Center and Learning Resources: FAQs, financial education materials, AI finance guides, budgeting articles, investment awareness content, tax planning information, product updates, and a knowledge base.

    Customer Support: Email support, in-app assistance, technical support, account support, financial service guidance, issue reporting, and help documentation.

    Conclusion

    Fin AI – All in One Finance is an innovative solution that merges AI-based financial intelligence with budgeting, investment planning, insurance, and credit management in a single mobile app. With its smart assistant, secure platform, and powerful money management features, Fin AI is a useful tool for daily finances. Although investment and financial products depend on regulation and market conditions, Fin AI serves as a capable digital helper for all financial needs.

  • Moneyview Review: All-in-One Financial App for Loans, UPI, Credit Tracking & Investments

    Moneyview Review: All-in-One Financial App for Loans, UPI, Credit Tracking & Investments

    Overview

    Moneyview is a comprehensive financial services portal that allows users to manage loans, track credit scores, make UPI payments, open fixed deposits, invest in gold, and obtain insurance — all from a single mobile application. By leveraging AI-powered credit scoring, quick loan approvals, secure digital payments, and investment tools, it simplifies personal finance management.

    General Information

    • Founded: 2014
    • Platform Support: Web, Android, iOS
    • Download: Available on official app stores

    Key Features

    • Instant digital loans for individuals, businesses, and domestic needs.
    • AI-driven credit tracker providing free credit score reports.
    • Moneyview UPI with 256-bit encryption and ISO 27001:2022 certification.
    • All-in-one platform for gold investments, fixed deposits, insurance, and credit cards.

    Benefits

    • Integrated financial management for better control over money.
    • Quick loan approvals with minimal documentation.
    • Free credit score monitoring to aid financial planning.
    • Secure digital payments and investments through reliable instruments.
    • Savings, insurance, and loans accessible within a single app.

    Challenges

    • Loan eligibility depends on creditworthiness and partner lender policies.
    • Interest rates and terms vary based on customer profile.
    • Some financial products are limited to specific geographic regions.
    • Special bank accounts require additional verification.
    • Investment returns and insurance benefits are subject to partner terms.

    Subscription Information

    Moneyview is free to download and use for basic services like credit management, UPI payments, and EMI calculators. Financial products such as personal loans, home loans, business loans, credit cards, fixed deposits, car insurance, and gold investments come with varying eligibility criteria, partner terms, interest rates, and charges.

    Support Options

    • Help Center & Learning Resources: FAQs, loan guides, EMI calculators, security resources, product information, grievance redressal, and financial education materials.
    • Customer Support: Email, phone assistance, customer care, grievance redressal, and partner support for financial products.

    Conclusion

    Moneyview is a versatile digital banking platform that combines lending, savings, investments, insurance, and credit monitoring. Its AI-powered convenience, robust security, and diverse product range make it a strong choice for managing personal finances. Users seeking highly specialized banking services or global banking may want to explore alternative platforms.