Category: Finance

  • Why Online Loans Are Becoming the Go-To Solution for Emergency Expenses

    Why Online Loans Are Becoming the Go-To Solution for Emergency Expenses

    Unexpected expenses rarely arrive at a convenient moment. A vehicle can break down, a heating system can fail, or an unexpected medical bill may appear before the next paycheck, requiring urgent financial decisions.

    Growing numbers of borrowers are responding by turning to online loans. Digital lending has become increasingly popular because it combines speed, convenience, and accessibility when unexpected expenses demand timely financial support.

    Understanding what’s driving this shift helps borrowers make more informed decisions. Looking beyond fast funding to compare loan features and repayment terms can lead to choices that better fit individual financial needs.

    The Shift Toward Online Loans for Emergency Expenses

    Online lending has evolved rapidly over the past decade, becoming a mainstream financial option for many households facing urgent and unexpected expenses.

    Digital applications, automated technology, and improved customer experiences have driven much of this growth. Borrowers increasingly value faster processes that reduce paperwork and simplify access to funding during unexpected financial emergencies.

    Changing consumer expectations have reinforced the shift. Many people now expect financial services to offer the same convenience and accessibility as online shopping or mobile banking, particularly when time is limited or when emergencies require prompt action.

    Economic pressures have also increased demand. Inflation, rising repair costs, and higher household expenses have reduced emergency savings, making personal loans a practical way to bridge unexpected financial gaps when essential costs can’t wait.

    Speed and Convenience Are Reshaping Emergency Borrowing

    When unexpected costs become a reality, every hour matters. Online lending platforms have streamlined applications and ease of funding, making them especially appealing during financial emergencies.

    Emergency Expenses Leave Little Time to Wait

    Many financial emergencies share one characteristic: delaying action often makes the problem worse. A broken vehicle can disrupt work, while a leaking pipe may cause more extensive and expensive property damage if left unrepaired.

    Overdue utility bills can lead to additional fees or service interruptions, while unexpected medical expenses often require prompt payment. In situations like these, many borrowers prioritize funding that avoids lengthy approval processes.

    Faster Applications Reduce Delays

    Modern online lenders have streamlined the borrowing experience. Digital applications can often be completed on a computer or smartphone, while identity and income verification increasingly rely on secure electronic systems instead of paper documents.

    Automated review processes also reduce waiting times compared with many traditional lenders. Rather than visiting a physical branch, borrowers can often submit applications whenever convenient, including evenings and weekends.

    Quick Funding Helps Resolve Urgent Costs

    Approval is only part of the equation during a financial emergency. Access to funds is equally important when essential expenses cannot be delayed or ignored.

    Many online lenders provide funding within one or two business days, with some offering even faster disbursement depending on eligibility and banking arrangements. That shorter timeline can help borrowers cover urgent expenses before costs escalate.

    Greater Accessibility Is Expanding Borrowing Options

    Digital lending has also broadened access to emergency financing by giving borrowers more ways to explore available options. Technology has made comparing lenders easier while encouraging lenders to prioritize more flexible approaches to evaluating applications.

    Many online lenders today consider factors beyond traditional credit scores, including employment, income, and overall financial circumstances. Some also offer soft-credit prequalification, making it easier to compare loan offers without affecting a borrower’s credit profile.

    Comparing CreditNinja online loans alongside other lenders helps borrowers evaluate loan amounts, eligibility, funding timelines, and repayment terms. Looking beyond a single feature often provides a clearer picture of the overall borrowing experience.

    Greater accessibility doesn’t mean every applicant will qualify or receive the same terms. It does give borrowers more opportunities to compare lenders offering products designed for different financial situations and borrowing needs.

    Predictable Repayment Structures Offer Greater Financial Clarity

    Speed may attract borrowers initially, yet repayment often determines whether a loan fits comfortably within an overall budget. Predictability has therefore become another reason many people prefer online installment loans for emergency expenses.

    Fixed monthly payments help borrowers understand exactly how much is due each billing cycle. Knowing the repayment schedule from the date the loan is taken can reduce uncertainty around household expenses and make budgeting easier during a stressful financial period.

    Installment loans also differ from revolving forms of credit because they generally include a defined repayment timeline. Borrowers know when the loan is expected to be fully repaid rather than carrying an open-ended balance (such as credit card debt) that can continue growing over time.

    A clearer loan structure can make it easier to plan for future expenses while balancing other financial priorities. Understanding how repayments fit within a household budget remains just as important as obtaining funds quickly when managing long-term financial stability.

    Choosing an Online Loan That Fits Your Financial Needs

    Funding speed is important, but it shouldn’t be the only factor when evaluating an online loan. Taking a few extra minutes to compare loan features can lead to a borrowing decision that better supports both immediate needs and long-term financial stability.

    When comparing online loans, borrowers should consider: Annual Percentage Rate (APR) – the yearly cost of borrowing, expressed as a percentage, repayment terms, funding timelines, origination or administrative fees, prepayment policies, and overall lender transparency.

    Comparing these factors helps borrowers understand the total cost of borrowing rather than focusing only on monthly payments or approval speed. Looking at the full picture often leads to more informed financial decisions.

    Borrowing only what is necessary and choosing repayment terms that fit comfortably within a household budget can make emergency financing more manageable over time. Careful planning also reduces the likelihood of future financial strain.

    Making More Informed Borrowing Decisions

    Online loans have become a popular option for emergency expenses because they align with consumer expectations for immediate, digital-first financial services. The application process tends to be faster, access can be wider, and the digital setup makes things easier, supporting timely financial decisions.

    Clear repayment details and consistent installment schedules make these loans more appealing in sudden situations. However, getting the money quickly isn’t the only factor that matters—understanding how repayment works can be just as important when something unexpected arises.

    Even if emergencies can’t be predicted, borrowing decisions can still be guided step by step. Comparing different lenders, reviewing loan conditions carefully, and choosing an option that matches both immediate needs and longer-term financial objectives helps build stronger financial confidence.


  • Why Bank Fraud Models Need Validation, Not Just Accuracy: A Deep Dive into the Blind Spot

    Why Bank Fraud Models Need Validation, Not Just Accuracy: A Deep Dive into the Blind Spot

    Every large bank now runs anti-money-laundering (AML) and fraud-detection models that score millions of transactions daily. The marketing tells one story—detection rates climbing, false positives falling, model architectures getting smarter. But inside the engineering organizations that ship and operate these systems, a different story is told: the models work on the day they were built. What happens on day 200 is a harder question most banks answer poorly.

    Few have answered that harder question as convincingly as Manu Subhashchandrabose, Director of Digital and AI Quality Engineering. His fraud- and AML-validation programs have set new benchmarks across the U.S. regional-banking sector, leading quality engineering behind a $200M+ multi-year core-banking transformation spanning six affiliate banks. The program went live with zero critical fraud-related defects and achieved 100% reconciliation accuracy on the data fraud models depend on.

    The Blind Spot: Accuracy vs. Validation

    Manu puts it bluntly: “Accuracy is not the real problem. Validation is.” A bank that confuses the two will fund a model team, ship a model, watch dashboards report 98% accuracy, and discover only after a regulatory examination that the 2% it missed was the 2% that mattered. The blind spot at the center of modern fraud detection is not in the model—it is in everything around it.

    The Drift Banks Do Not Want to See

    Fraud models are trained on yesterday’s behavior. Customers, criminals, upstream data feeds, rule libraries, and integration layers all shift continuously. The model does not. In the time it takes a quarterly compliance committee to meet, a behavioral fraud model can lose meaningful detection signal without producing any visible alert that something is wrong.

    “Fraud models inherit the weaknesses of the systems around them,” Manu explains. “If data pipelines, ETL jobs, or integration layers are flawed, even the most accurate model becomes blind.”

    His team built a data-lineage validation framework that traced every fraud-critical field from origin to model input, with reconciliation at each hop and threshold tests on the values. The result: 100% reconciliation accuracy on fraud-critical data, and model behavior stopped diverging across affiliate banks.

    Why False Positives Are a Validation Problem, Not a Tuning Problem

    Most banks treat AML false-positive rates as a tuning problem. Manu argues this approach is backwards. “Rules are outdated, undocumented, and inconsistent across systems. You can tune a threshold all day and never fix the fact that the underlying scenario library is missing cross-channel patterns, structured transactions, and country-specific triggers.”

    His teams designed scenario-based testing for structured transactions, currency-transaction-report triggers, sanctions screening, and behavioral anomalies. One AML modernization program produced a 40% increase in scenario coverage and a 15–20% reduction in false positives—because the scenario library got correct, not because someone moved a threshold.

    The Cloud Migration That Almost Broke a Fraud Stack

    The riskiest moment in a fraud model’s life is when its inputs move. Cloud migration of core banking systems means shifting customer profiles, transaction histories, AML flags, and behavioral features into cloud-native pipelines. A single mis-mapped field can corrupt a feature and degrade a model in ways that look like normal variation in alert volume.

    Manu led data-migration validation for one such cloud transformation. His teams built SQL-driven reconciliation across source and target, automated validation scripts on every batch, and data-quality dashboards that surfaced anomalies before the model team did. The program achieved 100% reconciliation accuracy on fraud-critical data and prevented post-migration degradation an accuracy-only regime would have missed.

    Continuous Validation as a Discipline, Not a Project

    The technical scaffolding is only half the story. The other half is governance. On the multi-year core banking transformation, Manu’s QA organization grew to 55 engineers across 10 teams. Quality gates were embedded in the build pipeline, and CI/CD integration accelerated AML rule deployment by 30–40% because rule changes were validated against a living scenario library on the way in rather than against a quarterly batch run.

    “Models degrade over time,” Manu says. “Validation must evolve with customer behavior, transaction patterns, and emerging fraud vectors. Treat the model as a living system, not a static algorithm.”

    What Regulators Are Now Asking For

    The supervisory environment has moved in his direction. Examiners increasingly probe for model-validation evidence rather than accuracy summaries. The Anti-Money Laundering Act amendments and OCC guidance have raised the bar on explainability, traceability, and ongoing validation.

    “Regulators are raising the bar,” Manu warns. “They are asking for explainability, traceability, and validation, not just accuracy metrics. The teams that can produce that evidence on demand are the ones that built it into the system.”

    His programs reported a 35–50% reduction in fraud-related production defects and 85–90% automation coverage across AML, CTR, sanctions screening, and high-risk transaction monitoring. The number that matters most to him is the absence of a category: no fraud-related production defect required executive escalation at go-live. That is a validation outcome, not a tuning outcome.

    The Misconception That Costs Banks the Most

    The mistake Manu wants banking-technology leaders to stop making is treating a high accuracy score as a license to relax. “A model with 98% accuracy can still miss the 2% of transactions that cause millions in fraud losses. Accuracy is a snapshot. Validation is a discipline.”

    Hire validation engineers alongside data scientists. Treat the ETL jobs that feed a model as part of the model’s surface area. Write scenario tests against regulatory expectations, not only against labeled datasets. Move validation left, into requirements and design, rather than treating it as a release-readiness checkbox.

    For an industry that has spent a decade pouring money into model sophistication, the shift is not glamorous. It is plumbing, governance, and discipline. The banks that build it—the way Manu has built it, program after program—are the ones whose fraud stacks still work the day after the data shifts, the rule library changes, or the next examiner walks in. The banks that do not will keep reporting impressive accuracy on models that have quietly stopped catching the fraud that matters.

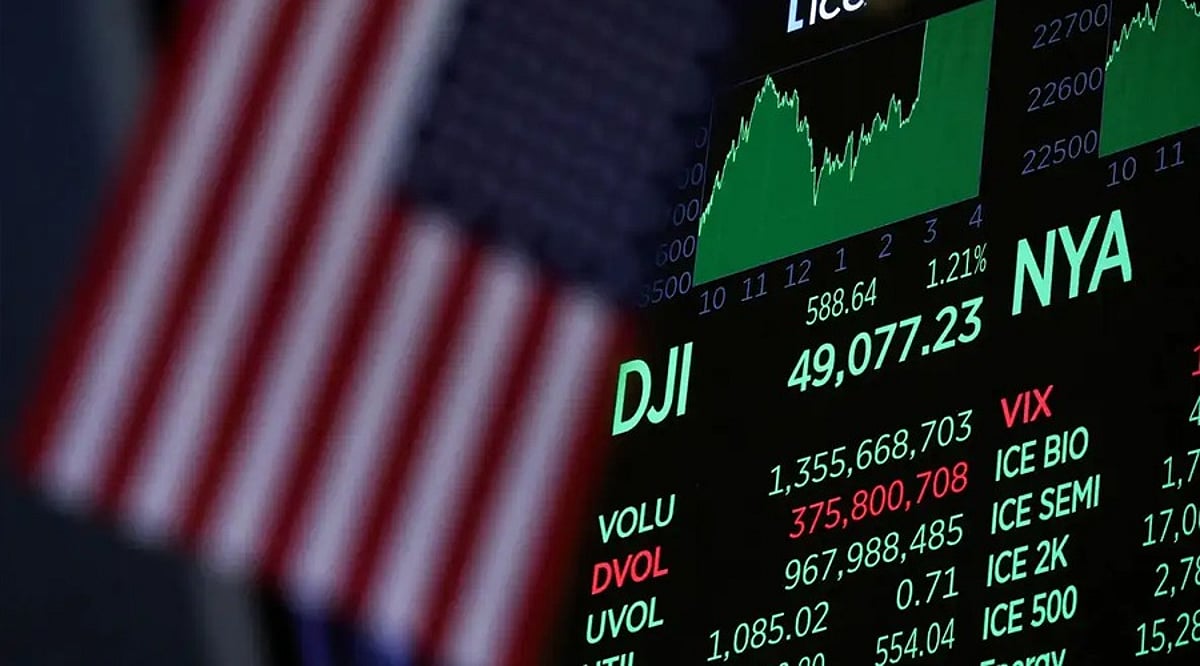
  • FTSE 100 Opens Lower After Rally as Brent Crude Surges Above $97; Mixed Corporate Earnings in Focus

    FTSE 100 Opens Lower After Rally as Brent Crude Surges Above $97; Mixed Corporate Earnings in Focus

    The FTSE 100 opened 16.72 points lower at 10,700.25 on Wednesday, pulling back after a sharp rally that pushed the index to a 20-week high of 10,716.97. The decline came as oil prices continued to climb, with Brent crude futures jumping 3.36% to $97.23 per barrel and US West Texas Intermediate (WTI) gaining 2.75% to $89.22.

    Gainers & Losers

    On the upside, Segro led the gainers with a 7.06% rise to 958.20p. Anglo American advanced 4.93% to 3,703p, while 3i Group rose 2.98% to 2,628p. RELX gained 2.61% to 2,518.00p, BP climbed 2.32% to 551.80p, and Tritax Big Box REIT added 1.84% to 171.90p.

    On the downside, Whitbread fell 3.14% to 2,379p. Endeavour Mining declined 2.49% to 3,650p, while London Stock Exchange Group slipped 1.34% to 8,566p. AstraZeneca dropped 1.26% to 12,542.00p, Games Workshop Group eased 0.90% to 19,920p, and Lion Finance Group edged 0.69% lower to 11,520p.

    Mixed Numbers from Centrica

    Centrica hiked its interim dividend by 9% despite lower first-half profits, as energy-market volatility slowed progress in parts of the British Gas owner’s business. Underlying earnings (EBITDA) of £737 million were reported for the six months to June, down 18% year-on-year. Statutory profit before tax swung to £672 million from a £43 million loss.

    Burnham to Cut Pub Business Rates

    Andy Burnham announced a 20% cut to business rates for pubs, clubs, and music venues, funded by cracking down on businesses like vape shops and tax-avoidant online sellers. The £100 million commitment follows a campaign by hospitality venues after tax bills soared due to Rachel Reeves’ Autumn Budget last year.

    EasyJet Profits Decline

    EasyJet reported a 70% fall in third-quarter profit, with headline profit before tax of £85 million for the three months to June, down from £286 million a year earlier. The Middle East conflict kept fuel costs elevated and affected bookings. Group revenue advanced 2% to £2.98 billion, but fuel costs jumped 17% to £732 million.

    Jupiter’s Net Inflows Continue

    Jupiter’s net inflows and profit jumped despite the loss of two mandates. Net inflows reached £700 million in the first half of the year, driven by momentum in retail, wholesale, and investments. Assets under management (AUM) rose 36% to £73.7 billion, supported by the acquisition of CCLA. Revenue grew 39% to £213.3 million.

    Global Market View

    In the US, the Nasdaq and S&P 500 fell 0.6% and 0.1%, respectively, while the Dow Jones finished little changed. In Asia, Tokyo’s Nikkei 225 rose 0.46% to 66,422.6, and China’s Shanghai Composite gained 0.25%. Hong Kong’s Hang Seng advanced 1.09%, and South Korea’s Kospi rose 4.4%. In India, the Nifty 50 and the Sensex fell 0.49% and 0.56%, respectively.

  • Indian Stock Market Ends Lower: Sensex, Nifty Fall as Banking and IT Stocks Weigh

    Indian Stock Market Ends Lower: Sensex, Nifty Fall as Banking and IT Stocks Weigh

    Indian benchmark indices Sensex and Nifty closed lower on Thursday, July 23, 2026, extending their losing streak to a fourth consecutive day. Rising crude oil prices, geopolitical tensions in West Asia, and sustained selling pressure in banking, pharmaceutical, and IT stocks dampened investor sentiment, offsetting gains in select auto and consumer sectors.

    The BSE Sensex fell below the 76,600 mark during the session, while the NSE Nifty 50 remained weak under the psychologically important 24,000 level. At 14:55 IST, the Sensex was down 517.34 points or 0.67% at 76,237.71, and the Nifty was down 167.35 points or 0.70% at 23,828.90. About 1,440 shares advanced, 2,361 declined, and 148 remained unchanged.

    Market Drivers

    Rising crude oil prices, fueled by tensions between the US, Iran, and the Red Sea region, remained the primary factor influencing investor mood. Concerns over inflation, higher import costs, and compressed corporate profitability weighed on sentiment.

    Top Gainers

    Investor interest was largely confined to automobile and industrial stocks, where companies with strong income prospects and robust domestic demand outperformed. Auto shares led the market despite the overall negative tone.

    Top Losers

    Pharmaceutical shares came under pressure after Dr. Reddy’s Laboratories reported weak quarterly results. Banks and financial services firms also faced selling. Defensive stocks like Nestlé India were among the major laggards.

    Market Trends

    Thursday’s session reinforced the cautious mood across Dalal Street. Brent crude oil prices near $96–$97 per barrel raised concerns about rising energy costs potentially fueling inflation, widening India’s current account deficit, and squeezing corporate margins. Despite the negative macro backdrop, market participants continued to focus on the earnings season, with some blue-chip results disappointing.

    What Investors Can Take Away

    The market remains influenced by macroeconomic events rather than company-specific news. Heightened geopolitical tensions and rising oil prices have prompted a risk-off stance, leading to selective buying rather than broad participation. The resilience of automobile and industrial stocks, however, indicates that investors are still willing to back sectors with strong domestic fundamentals. In the coming days, corporate results, oil price movements, and global geopolitical developments will drive market direction.

    Note: Percentage gains for some stocks were not officially disclosed in end-of-day summaries, but they featured among the session’s strongest performers.

    Disclaimer: This article is provided for informational purposes only and does not constitute investment advice. You are responsible for conducting your own research (DYOR) before making any investment decisions. Financial markets involve risk, and past performance is not indicative of future results.

  • AI’s Quiet Revolution: Transforming Banking and Finance for the Better

    AI’s Quiet Revolution: Transforming Banking and Finance for the Better

    Artificial intelligence is quietly revolutionizing the banking industry, making financial services faster, smarter, and more personalized for millions of customers around the world. From 24/7 customer support to real-time fraud detection, AI is becoming an invisible but essential part of modern finance.

    Banks are increasingly deploying AI-powered virtual assistants to handle customer inquiries, process routine requests, and provide round-the-clock support with greater accuracy than ever before. These systems learn from each interaction, improving their responses over time.

    Behind the scenes, advanced AI algorithms analyze millions of transactions in real time, flagging suspicious activity before it leads to major losses. This proactive fraud detection helps protect both customers and financial institutions.

    Loan approvals, once a slow and paper-heavy process, are now being accelerated by AI models that evaluate financial data, credit history, and risk factors in seconds. This speeds up access to credit for consumers and small businesses alike.

    Personalization is another key area where AI is making a difference. Banks use AI to deliver tailored financial advice, spending insights, and product recommendations based on individual customer behavior and preferences.

    New AI agents are beginning to automate routine banking operations, reducing manual workloads and boosting efficiency across the board. Yet financial institutions continue to invest in strong governance, cybersecurity, and human oversight to ensure responsible AI adoption.

    Experts predict that AI will increasingly support customer service, compliance, fraud prevention, and strategic decision-making throughout the banking sector. As the technology advances, the future of banking promises to be faster, safer, and more efficient—all while delivering superior customer experiences.

  • Eternal Q1 FY27: Profit Slips 47% Sequentially as Blinkit Drives Record Revenue Growth

    Eternal Q1 FY27: Profit Slips 47% Sequentially as Blinkit Drives Record Revenue Growth

    Eternal, the parent company of Zomato, Blinkit, Hyperpure, and District, reported its financial results for the quarter ended June 30, 2026. Despite a surge in revenue driven by its quick commerce arm Blinkit, the company’s consolidated net profit fell 47.1% sequentially to ₹92 crore, compared to ₹174 crore in the same quarter last year. The decline was attributed to continued investments in business expansion, particularly in Blinkit.

    Revenue Surge Fueled by Blinkit and Model Change

    Revenue from operations soared to ₹20,211 crore, up from ₹7,167 crore in the prior-year period. Eternal attributed this increase primarily to the shift to a first-party (1P) operating model, which recognizes the full value of goods sold as revenue. Consolidated adjusted revenue grew 173% year-on-year to ₹20,648 crore, while adjusted EBITDA more than doubled to ₹555 crore.

    The B2C segment’s net order value (NOV) rose 54% YoY to ₹31,120 crore, underpinned by strong demand in food delivery, quick commerce, and the going-out business.

    Blinkit Continues to Lead Growth

    Blinkit remained Eternal’s fastest-growing business, with NOV climbing 86% YoY to ₹17,132 crore. The quick commerce platform posted an adjusted EBITDA profit of ₹102 crore, marking its fifth consecutive quarter of margin improvement. Blinkit expanded its store network by 200 net new stores, reaching 2,443 locations, and focused on assortment expansion, geographic coverage, and demand densification.

    Deepinder Goyal, Founder of Eternal, commented: “If we’re doing our job well, growth and margins should compound together – because growth in this business comes from making the platform more useful to more people, which drives frequency, which drives density, which drives efficiency. The flywheel doesn’t ask you to choose.”

    Food Delivery and Other Segments Hold Steady

    Eternal’s food delivery business also maintained momentum, with NOV crossing ₹10,769 crore, up over 20% YoY. The segment reported an adjusted EBITDA profit of ₹606 crore, with margins improving to 5.6%. The going-out platform, District, achieved 60% YoY revenue growth to ₹3,218 crore, while Hyperpure posted revenue of ₹1,034 crore, a 27% increase on a like-for-like basis.

    Additionally, Eternal entered into a Business Transfer Agreement with its wholly owned subsidiary Carthero Technologies Private Limited to transfer the business under the brand name ‘Nugget by Zomato’ as part of an internal restructuring to streamline operations.

  • Red Sea Attacks Spark Selloff on Dalal Street: Sensex and Nifty Slump on Oil Supply Fears

    Red Sea Attacks Spark Selloff on Dalal Street: Sensex and Nifty Slump on Oil Supply Fears

    Indian equity markets ended lower on Thursday as renewed attacks in the Red Sea stoked fears of oil supply disruptions, sending crude prices higher and dampening investor sentiment. The benchmark BSE Sensex dropped 0.28% to 76,539.97, while the Nifty 50 slipped 0.21% to 23,945.30, according to TradingView data.

    The selloff was triggered by the Houthi militia’s strikes on two Saudi oil tankers in the Red Sea, following a warning from the UK Maritime Trade Operations (UKMTO) about a potential attack on a commercial vessel off the coast of Saudi Arabia. The incidents have intensified concerns over the safety of one of the world’s busiest shipping lanes, raising the specter of prolonged disruption to global oil flows.

    Crude Oil Surge Puts Pressure on India’s Economy

    Geopolitical instability pushed Brent crude near the $96-per-barrel mark, while West Texas Intermediate (WTI) crude hovered above $88 per barrel. For India, which imports the majority of its crude oil requirements, higher prices are expected to widen the import bill, stoke inflationary pressures, and potentially weaken the rupee. This combination is likely to weigh on investor appetite for equities, particularly in sectors reliant on expensive raw materials.

    Banking and Realty Stocks Lead the Decline

    Selling pressure was broad-based, with profit booking observed in banking, financial services, real estate, healthcare, and pharmaceutical stocks. Midcap and smallcap indices also closed in negative territory, reflecting a cautious mood across the market. However, losses were partially offset by gains in automobile stocks, which extended their recent rally on the back of strong corporate earnings. Media shares also managed to stay afloat, trading modestly higher during the session.

    Markets Await Fresh Global Cues

    Investors are now closely monitoring developments in the Red Sea and the broader West Asia conflict, along with crude oil price movements. Any further escalation in geopolitical tensions or signs of supply disruptions could keep volatility elevated in the coming sessions. At the same time, domestic earnings reports and global economic data are expected to influence the near-term direction of the markets.

    Join our WhatsApp Channel to get the latest news, exclusives, and videos on WhatsApp.

  • Dow Rises, Nasdaq Slips as Wall Street Awaits Alphabet and Tesla Earnings Amid Rising Oil Prices

    Dow Rises, Nasdaq Slips as Wall Street Awaits Alphabet and Tesla Earnings Amid Rising Oil Prices

    U.S. stocks ended mixed on Wednesday as investors weighed rising oil prices, a downturn in semiconductor shares, and anticipation of major earnings reports from technology giants. The Dow Jones Industrial Average gained roughly 0.5%, while the S&P 500 hovered near the flatline. The Nasdaq Composite fell about 0.3%, dragged lower by weakness in chip stocks.

    Big Tech Earnings in Focus

    Alphabet, Tesla, IBM, ServiceNow, and Texas Instruments are set to report quarterly results after the closing bell. Their updates are expected to shed light on artificial intelligence spending, cloud demand, and corporate technology budgets. Alphabet and Tesla are the first members of the ‘Magnificent Seven’ to release second-quarter results, with investors closely watching revenue growth, capital expenditure, and forward guidance.

    Alphabet shares traded near $346 ahead of the report. The company faces scrutiny over its AI strategy after delaying a model launch tied to its development plans. Tesla’s results will also be closely watched as the automaker continues heavy spending on new projects. Analysts will focus on cash flow, operating costs, and capital outlays.

    Sam Stovall, chief investment strategist at CFRA Research, noted that investors may adopt a ‘wait-and-see attitude’ before making larger market moves, with spending levels playing a central role in the response to these earnings.

    Oil Prices Surge on Geopolitical Tensions

    Oil prices climbed as the United States conducted its eleventh straight round of strikes against Iran. Brent crude rose about 3% to trade above $93 per barrel, briefly crossing $95. West Texas Intermediate advanced above $86 per barrel. U.S. Secretary of State Marco Rubio stated that Washington would continue protecting shipping through the Strait of Hormuz and described Iran as ‘not serious’ about negotiations.

    Higher energy prices reignited concerns about inflation and interest rates. Federal funds futures indicated a strong likelihood that the Federal Reserve will hold rates steady at its next meeting, though markets still price in a potential rate increase later in 2026.

    Chip Stocks Weigh on Nasdaq

    Technology stocks were the weakest sector during morning trading, with semiconductor shares under pressure after several volatile sessions. The Philadelphia Semiconductor Index traded near unchanged levels, having closed lower in five of the past ten sessions. Texas Instruments edged lower ahead of its earnings release. Investors are scrutinizing chip demand, order growth, and management forecasts during this earnings season. AI infrastructure spending has supported semiconductor valuations, but recent price swings have slowed the Nasdaq’s momentum.

    Materials and utilities sectors moved higher, limiting broader market losses. Strength in industrial and materials shares also supported the Dow. Market breadth remained positive, with advancing stocks outnumbering decliners on both the NYSE and Nasdaq.

    Notable Stock Movers

    Super Micro Computer surged more than 20% after the AI server maker issued a strong business update, securing over $60 billion in new fourth-quarter orders and forecasting gross margins above previous expectations. AT&T gained about 3% after adding more wireless subscribers than analysts anticipated and reporting better-than-expected quarterly earnings.

    GE Vernova shares fell despite reporting $11.1 billion in revenue and raising its 2026 guidance, as earnings missed market estimates. The company posted an 88% rise in total orders to $24.2 billion, with data center orders exceeding $5 billion in the first half of the year—more than double its full-year total in 2025.

    Shares of generic drugmakers declined after President Donald Trump announced plans for future tariffs on imported generic medicines, starting with a 100% tariff in August 2028 and rising to 200% a year later.

    With oil prices rising and Big Tech earnings approaching, markets remain focused on the next major catalyst for direction.

  • Tesla Stock Awaits Q2 Earnings: Margins, Cash Flow, and Robotaxi Updates in Focus

    Tesla Stock Awaits Q2 Earnings: Margins, Cash Flow, and Robotaxi Updates in Focus

    Tesla stock edged higher ahead of its second-quarter earnings report, as investors zeroed in on automotive margins, free cash flow, and rising capital expenditures. The upcoming results, due after the market close on Wednesday, July 22, will also shine a spotlight on the company’s progress with Robotaxi expansion, Optimus humanoid robot production, and whether stronger vehicle deliveries can offset mounting costs.

    Shares gained roughly 3% on Tuesday, rebounding from four consecutive losing sessions, though the stock remains down about 13% for 2026.

    Deliveries Recover, Bolstering Revenue Forecasts

    Tesla delivered 480,126 vehicles in the second quarter, a 25% increase year over year. Production reached 451,758 units, while energy storage deployments hit 13.5 gigawatt-hours. Model 3 and Model Y accounted for 467,762 deliveries.

    The company’s internal consensus points to quarterly revenue of approximately $27.58 billion. Analysts expect adjusted earnings of roughly $0.55 per share, up from $0.40 a year ago. Broader market estimates place revenue between $26.2 billion and $27.7 billion.

    The delivery rebound may provide a tailwind for automotive revenue after weaker periods. However, Tesla cautioned that pricing, production costs, foreign exchange rates, and product mix also influence profitability.

    Margins and Cash Flow Under Pressure

    Wall Street forecasts Tesla’s automotive gross margin, excluding regulatory credits, will fall to about 18.1%, down from 19.2% in the previous quarter. Financing incentives, vehicle discounts, and higher input costs could further weigh on the metric.

    Free cash flow is likely to draw particular scrutiny. LSEG data points to negative free cash flow of roughly $3.3 billion for the period, which would mark Tesla’s first quarterly cash burn in more than two years.

    Gene Munster of Deepwater Asset Management expects automotive margins to slightly exceed consensus and projects second-quarter capital spending of about $6.7 billion. “I expect good news,” Munster wrote, but questioned how investors would react to higher spending in 2027.

    In April, Tesla raised its 2026 capital expenditure plan above $25 billion, covering data centers, vehicle plants, robotaxis, and the Optimus humanoid robot program. Investors will be watching whether operating cash flow can fund these projects without severely depleting Tesla’s cash reserves.

    Robotaxi Timelines Return to the Forefront

    Gary Black of The Future Fund noted that repeated missed Robotaxi targets have eroded confidence in Tesla’s public timelines. He pointed to Elon Musk’s earlier forecast that the service would cover half of the U.S. population by the end of 2025.

    Tesla expanded Robotaxi coverage to Orlando and Tampa ahead of earnings, but the service remains limited compared with earlier national ambitions. The company has started production of the Cybercab, though those vehicles have not yet entered its commercial network.

    Investor questions also center on the Optimus production schedule and obstacles slowing Robotaxi expansion. Nine of the ten most-supported questions on Tesla’s investor platform concern artificial intelligence projects, Full Self-Driving, Robotaxi, or Optimus.

    Shareholders have also asked about market speculation regarding a potential Tesla-SpaceX merger. Neither company has confirmed such a transaction. The earnings call is expected to focus on reported financials, spending plans, and management’s timelines for products that have yet to generate significant revenue.

    Tesla shares traded near $379 early Wednesday, placing its market capitalization above $1.3 trillion. The earnings call will begin at 5:30 p.m. Eastern Time.

  • How Disconnected Payment Data Undermines Business Performance and What to Do About It

    How Disconnected Payment Data Undermines Business Performance and What to Do About It

    Ask most finance or operations teams how their payment data is structured, and you’ll get a version of the same answer: it depends which provider you mean. Authorization rates live in one dashboard. Settlement reports come from another system, on a different schedule, with different field names. Chargeback data sits somewhere else entirely. None of it is wrong, exactly — it’s just disconnected. And that disconnection has a cost that rarely gets attributed to its actual source.

    Payment data fragmentation is one of those problems that doesn’t announce itself. It shows up as slow month-end closes, as decisions that take longer than they should, as performance issues that go unnoticed until they’ve already cost real money. This is what fragmentation actually does to a business, and what reduces it.

    What Payment Data Fragmentation Actually Looks Like

    Fragmentation isn’t a single event. It’s the cumulative effect of payment data living in multiple places, in multiple formats, updated on multiple schedules — with no layer that brings it together. It happens for understandable reasons. A business adds a second payment provider for a new market. Each provider has its own dashboard, its own API, its own reporting structure. Transaction data, settlement data, dispute data, and fee data all come from each provider independently. Multiply that by three or four providers, and you have a payment data environment where no single system holds the full picture.

    The fragmentation isn’t limited to provider-to-provider differences, either. Within a single provider, transaction-level data, settlement-level data, and reporting-level data sometimes use different identifiers and update on different timelines — which means even “one provider” can produce data that doesn’t cleanly line up with itself.

    Inconsistent Reporting Across Providers

    The most immediate symptom of fragmentation is that reports from different providers don’t mean the same thing. One provider might report a “decline” using a generic code. Another might break declines into a dozen specific reason codes. One settles in the transaction currency; another settles after currency conversion, with the conversion rate applied at a different point in time. Field names differ — what one provider calls a “transaction ID” might be called a “reference number” by another, with no shared identifier connecting the two.

    None of these differences are arbitrary. They reflect how each provider built their own systems. But the effect is that a report pulled from Provider A and a report pulled from Provider B can’t be combined without manual translation — and that translation work has to happen every time someone wants a combined view.

    Poor Visibility Into Payment Performance

    When transaction data is spread across multiple systems, getting a complete view of payment performance requires pulling from all of them — and that’s rarely done routinely, because it’s expensive in time. The result is that most businesses operate with partial visibility most of the time. They can see overall revenue and volume easily enough — those numbers tend to be tracked centrally regardless. What’s harder to see is the detail underneath: authorization rates broken down by provider, by card type, by geography. Decline patterns that might indicate a routing problem. Processing costs that vary by transaction type and route.

    This detail is exactly the kind of payment analytics that drives optimization — and it’s exactly the kind of data that fragmentation makes expensive to produce. So it often just isn’t produced, except as an occasional special project.

    Decisions That Take Longer Than They Should

    Fragmented data doesn’t just make analysis harder — it makes decisions slower, because someone has to do the analysis before the decision can be made. Consider a simple question: should we route more transactions to Provider B for a specific card type, because Provider A’s authorization rates have been declining? Answering that requires comparing authorization rates across providers, for a specific segment, over a specific time period. If that comparison requires manually pulling and reconciling data from two separate dashboards, the question doesn’t get answered quickly — it gets answered when someone has time to do the legwork.

    In practice, this means payment performance issues often persist for weeks longer than they need to. Not because nobody noticed something seemed off, but because confirming it and acting on it required more effort than the day-to-day workload allowed for.

    Reconciliation Becomes a Recurring Drain

    Reconciliation — matching transactions to settlements, settlements to bank deposits, and fees to invoices — is where fragmentation costs show up most concretely for finance teams. Without a unified transaction data layer, reconciliation means: exporting reports from each provider separately, often in different file formats; manually mapping transaction references across systems that use different identifiers; adjusting for currency conversion differences between what was authorized and what settled; and investigating discrepancies one by one, often without a clear record of why a given transaction doesn’t match.

    This work tends to repeat every reporting period, with the same manual steps each time. It’s the kind of recurring cost that’s easy to normalize — “that’s just what month-end looks like” — but that normalization is itself a sign of how deeply fragmentation has been absorbed into how the business operates.

    Optimization Becomes Guesswork

    Payment optimization — improving routing, adjusting fraud rules, renegotiating provider terms — depends on being able to measure the effect of changes. Fragmented data makes that measurement difficult in both directions: before a change, to identify where the opportunity is, and after a change, to confirm it worked. A business considering a new routing rule needs to know, with reasonable confidence, what its current authorization rates look like by provider and segment. Without that baseline, the new rule is implemented on intuition rather than data — and its impact is hard to verify afterward, because the same fragmented reporting that made the baseline unclear also makes the result unclear.

    Over time, this means optimization work in fragmented environments tends to be sporadic and reactive — triggered by an obvious problem rather than ongoing refinement based on data that’s readily available.

    Why Centralized Payment Visibility Changes the Picture

    The common thread across all of these issues is that fragmentation turns routine questions into projects. Centralized payment visibility — a single, normalized view of transaction data across all providers — turns those projects back into routine questions. When transaction data, settlement data, and fee data from every provider flow into a single normalized structure, comparisons that used to require manual work become straightforward. Authorization rates by provider and segment are visible without exporting anything. Reconciliation becomes a matching exercise against a single source of truth rather than a cross-provider translation task. Decline patterns that might indicate a routing issue are visible as they emerge, not discovered weeks later during a performance review.

    This isn’t just about convenience. It changes the cadence of payment operations from reactive to ongoing — from “we’ll look into this when something seems wrong” to “we can see this continuously and adjust as needed.”

    Practical Ways to Reduce Payment Data Fragmentation

    Normalize data at the point of collection. The most effective fix happens upstream of reporting. Rather than collecting each provider’s data in its native format and reconciling differences later, a normalization layer translates each provider’s output into a consistent schema as transactions happen. Reports built on top of normalized data don’t require translation — the translation already happened.

    Use a single interface for provider-facing operations. For businesses managing payments on behalf of sub-merchants or operating branded payment products, fragmentation often extends to the provider-facing side as well — different merchant onboarding flows, different reporting interfaces for different acquirers. A white label payment gateway that presents a single interface regardless of which providers operate underneath it removes this layer of fragmentation for merchants and partners, not just for internal teams.

    Build reconciliation around a unified transaction record. Reconciliation tooling that operates against a single, normalized transaction record — rather than against each provider’s native export — turns a recurring manual process into an automated matching exercise. Discrepancies get flagged against a consistent baseline, which makes investigation faster and more reliable.

    Make payment analytics a standing capability, not a project. When the data layer is unified, payment analytics stops being something that requires a special data pull. Authorization rates, decline patterns, and processing costs by route become things that can be checked routinely — which is what makes ongoing optimization realistic rather than aspirational.

    Centralize provider management at the infrastructure level. The most durable fix addresses fragmentation at its source: provider connections themselves. Corefy centralizes data across connected providers into a single normalized layer, so payment operations, finance, and analytics teams work from one consistent dataset regardless of how many providers are active underneath it.

    Fragmentation Is a Solvable Problem, Not a Permanent State

    Payment data fragmentation tends to be treated as an inevitable consequence of using multiple providers — something to work around rather than something to fix. That framing undersells how much it costs. The slower decisions, the recurring reconciliation work, the optimization opportunities that go unaddressed because confirming them takes too much effort — these aren’t fixed costs of doing business with multiple providers. They’re costs of not having a unified data layer underneath those providers.

    Businesses that address fragmentation directly — through normalization, centralized reporting, and unified provider management — don’t just save time on reconciliation. They gain the ability to see their payment performance clearly enough to actually improve it, on an ongoing basis, rather than only when something has already gone wrong.