Category: Finance

  • Sony CEO Hiroki Totoki Sells 56% of His Stake: What It Means for Investors and PlayStation Fans

    Sony CEO Hiroki Totoki Sells 56% of His Stake: What It Means for Investors and PlayStation Fans

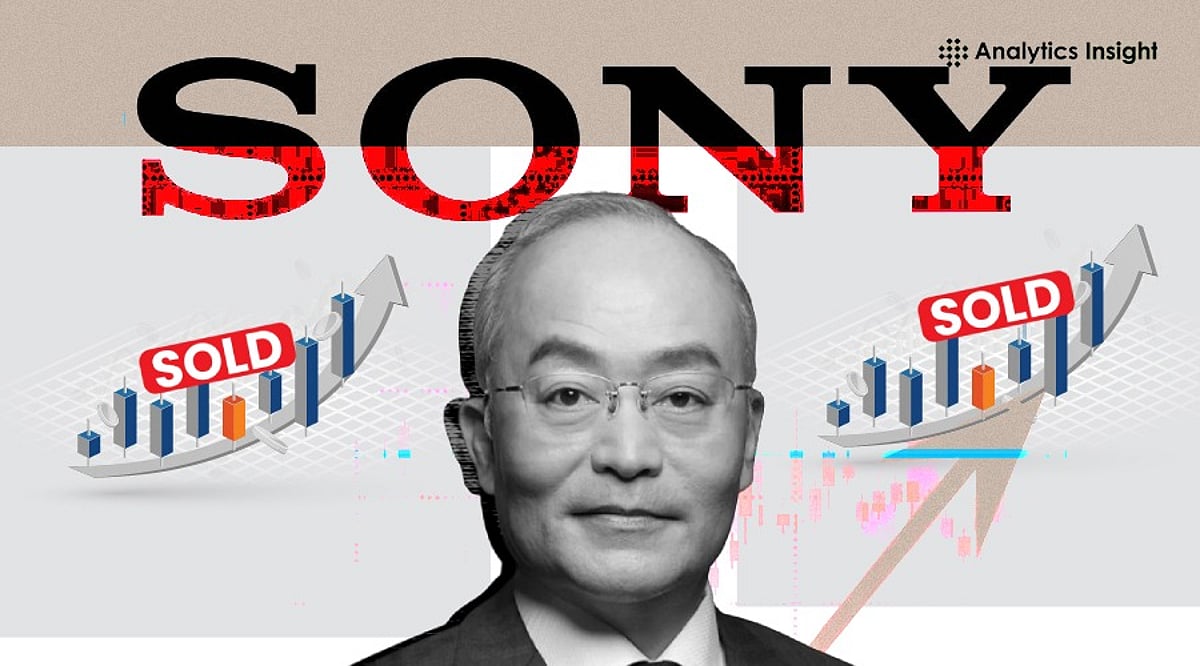
    Sony CEO Hiroki Totoki has sold more than half of his personal Sony shares, a move that has drawn intense scrutiny from investors and the gaming community. The transaction, disclosed in a recent SEC filing, comes at a time when the company is making bold decisions about its digital future, including the withdrawal of physical PlayStation discs.

    Details of the Stock Sale

    According to the filing made on July 3, Totoki sold 225,000 shares of Sony stock, representing approximately 56% of his stake. The shares were sold at $21.02 each, netting the CEO about $4.7 million. He still holds 173,250 shares. Additionally, on the same day, he sold another 25,000 shares (about 18% of his remaining stake) for $525,500. The timing of the filing—two days after Sony announced the end of physical PlayStation discs—has fueled speculation.

    Why the Timing Matters

    Investors often watch insider trades closely, and a CEO sale can trigger questions about confidence in the company. Sony has recently faced backlash over rising prices, subscription changes, and the shift toward digital-only gaming. Many players worry about fewer choices and higher costs. When a top executive sells a large chunk of shares during such turbulence, it naturally raises eyebrows.

    However, a filing only confirms that shares changed hands—it does not reveal the seller’s motivation. Executives sell stock for many reasons: tax planning, portfolio diversification, estate management, or personal financial needs. There is no public evidence linking this sale to any specific PlayStation decision or a loss of faith in Sony’s future.

    What This Means for Sony

    Context is crucial. One insider sale does not define a company’s trajectory. Sony remains a powerhouse in gaming, music, movies, and electronics. Its long-term success depends on product innovation, strategic execution, and market performance—not on a single stock transaction.

    For now, the filing shows that Hiroki Totoki sold a significant portion of his Sony shares. Beyond that, the interpretation is open. Investors should consider the broader picture rather than jumping to conclusions based on timing alone.

  • SBI Funds Management IPO Opens July 14: Shareholder Quota Details and Key Dates

    SBI Funds Management IPO Opens July 14: Shareholder Quota Details and Key Dates

    SBI Funds Management, one of India’s largest asset management companies, is set to launch its Rs 11,693-crore initial public offering (IPO) next week, with shares expected to list on the BSE and NSE on July 21. The issue opens for subscription on July 14 and closes on July 16, with a price band of Rs 545–574 per share, valuing the company at approximately Rs 1.17 lakh crore post-listing.

    IPO Structure and Key Dates

    The entire offering is structured as an offer for sale, meaning no fresh shares are being issued. Existing promoters State Bank of India (SBI) and Amundi India Holding are offloading up to 20.39 crore shares, representing a combined 10% stake. Anchor investor bidding begins a day earlier, on July 13. Allotment is expected to be finalized on July 17–18, with refunds and share credits scheduled for July 20, just ahead of the listing.

    Shareholder Quota and Eligibility

    Existing SBI shareholders have a unique reservation category. The bank has reserved about 1.3 crore shares, valued at nearly Rs 750 crore, for its shareholders. This represents approximately 6.41% of the entire offering. To be eligible, investors must hold SBI shares in their demat accounts up to the IPO’s record date. Shares purchased after that date will not qualify for this category.

    Unlike many IPOs, there is no price discount for SBI shareholders. However, eligible SBI employees have been allotted shares worth about Rs 170 crore at a discount of Rs 54 per share. The allotment breakdown is: 50% for qualified institutional buyers, 35% for retail investors, and 15% for non-institutional investors.

    Company Financials and Backing

    SBI Funds Management held a 15.4% market share in mutual funds as of December 2025, with quarterly average assets under management of Rs 12,49,970 crore. The company’s income rose from Rs 3,426 crore in FY24 to Rs 4,236 crore in FY25, while profit after tax increased from Rs 2,073 crore to Rs 2,540 crore—representing an approximate 17% increase in income and 21% in profit after tax. The IPO has received backing from prominent investors such as ADIA and GIC.

    This listing represents a substantial gain for SBI from an investment made decades ago. SBI acquired a 61.73% equity stake in SBI Funds Management at a weighted average cost of just Rs 0.15 per share, which is now valued at about Rs 68,670 crore.

    With strong institutional interest and the company’s market leadership, the listing will be closely watched as a key indicator of investor confidence in India’s asset management sector.

  • Nifty 50 Holds Above 23,800, Sensex Targets 77,000 as Middle East Tensions Fuel Volatility

    Nifty 50 Holds Above 23,800, Sensex Targets 77,000 as Middle East Tensions Fuel Volatility

    The Indian stock market is expected to open higher on short covering after a sharp sell-off as investors remain cautious about the renewed US-Iran war tensions and rising crude oil prices. GIFT Nifty also indicates a gap-up opening, trading at 23,976 with a premium of 64 points from its previous Nifty futures close.

    On Wednesday, the Sensex plunged 1,677.12 points or 2.15% to settle at 76,503.60, while the Nifty 50 fell 516.65 points or 2.12% to finish at 23,882.05.

    Among broader indices, Nifty Midcap 100 shed 1.5% and the Nifty Smallcap 100 index declined 2.2%.

    The Indian rupee opened flat at Rs. 95.55 per dollar on Thursday versus the previous close of Rs. 95.55.

    Foreign institutional investors (FIIs) remained net buyers in Indian equities on July 8, purchasing shares worth Rs. 1,962.80 crore, while Domestic institutional investors (DIIs) also stayed on the buying side, investing Rs. 790.16 crore.

    Sensex Outlook

    Technically, the Sensex formed a long bearish candle on the daily chart, indicating further weakness from the current levels.

    “We are of the view that the short-term texture of the market has changed to negative from positive, and for day traders, selling on rallies would be the ideal strategy. For day traders, 77,000 and 77,100 would act as immediate resistance levels for the bulls. As long as it is trading below these levels, weak sentiment is likely to continue on the downside. The market could retest the level of the 50-day SMA (Simple Moving Average), around 76,000. Further downward movement may also continue, which could drag the index to 75,800,” said Shrikant Chouhan, Head Equity Research, Kotak Securities.

    On the flip side, above 77,100, the sentiment could change. If the index moves above this level, a pullback could continue till 77,400-77,500. The current market texture is volatile; hence, level-based trading would be the ideal strategy for day traders, he added.

    Nifty 50 Outlook

    The Nifty 50 formed a long bearish candle with a lower high, lower low and a bearish gap, indicating that sellers currently have the upper hand.

    Bajaj Broking noted that the index erased its recent gains after slipping below the important support zone around 24,250 and eventually tested the 23,800 mark during intraday trade.

    “Going ahead, a breach below the key support area of 23,800 will open further downside towards the 23,500-23,600 levels in the coming sessions being the confluence of the previous gap area and 61.8% retracement of the entire previous up move 23,070-24,530. While holding above 23,800 will lead to consolidation in the range of 23,800-24,350. Immediate bias remains down below Wednesday’s gap down area of 24,350,” said the brokerage.

    Bank Nifty Outlook

    On Wednesday, Bank Nifty slumped 1,458.10 points or 2.51% to close at 56,742.60, forming a bearish candle on the daily chart and slipping below its 20-day EMA for the first time since June 8.

    “The index has entered a corrective phase after failing to hold key support levels. Index contrary to our expectations closed below the immediate support area of 57,000-56,800 signaling corrective bias. A follow through weakness will open further downside towards 55,500-56,000 levels in the coming sessions,” said Bajaj Broking Research.

    The brokerage further added, “On the higher side only a move above 58,000 will signal resumption of the up-move failure to do so will lead to some consolidation in the range of 55,000-58,000 levels.”

    Disclaimer: This article is provided for informational purposes and does not constitute investment advice. You are responsible for conducting your own research before making any investments.

  • Gold Prices Slide on MCX as Middle East Tensions and Fed Rate Hike Expectations Dampen Sentiment

    Gold Prices Slide on MCX as Middle East Tensions and Fed Rate Hike Expectations Dampen Sentiment

    Gold futures on the Multi Commodity Exchange (MCX) declined on July 9, driven by renewed geopolitical tensions between the US and Iran and growing expectations of aggressive monetary tightening by the Federal Reserve. August gold futures slipped 0.24% to Rs. 1,43,371 per 10 grams, while September silver futures dropped 0.44% to Rs. 2,22,464.

    On the global front, Brent crude oil futures rose 1.05% to $78.84 a barrel, and US West Texas Intermediate (WTI) crude advanced 1.07% to $74.31 a barrel, as market participants priced in the increased risk premium from the unstable US-Iran ceasefire agreement.

    According to the CME FedWatch Tool, traders now see a 68% probability of a Fed rate hike in September, up from 63% previously. This repricing of a possible second interest rate hike as early as Q1 next year has been a key factor pressuring gold prices, according to Kelvin Wong, senior market analyst at OANDA.

    Domestic and US Gold Prices

    In India, 24K gold fell by Rs. 11 to Rs. 1,43,240 per 10 grams, while 22K gold declined by Rs. 10 to Rs. 1,31,300. City-wise, Mumbai and Kolkata recorded prices at Rs. 1,43,240, Delhi at Rs. 1,43,390, and Chennai at Rs. 1,44,220.

    Internationally, spot gold dropped 0.4% to $4,060.46 per ounce, hovering near a one-week low. US gold futures for August delivery were down 0.3% at $4,069.80. Spot silver fell 0.9% to $57.77 per ounce, while platinum rose 0.8% to $1,591.13 and palladium gained 0.8% to $1,223.95.

    Key Levels to Watch

    Analysts have identified key support and resistance levels for gold and silver. Internationally, gold has support at $4,055 and $4,010 and resistance at $4,122 and $4,150 per troy ounce. Silver has support at $57 and $55.50 and resistance at $60 and $61.40.

    On the MCX, gold has support at Rs. 1,43,100 and Rs. 1,42,200 and resistance at Rs. 1,44,400 and Rs. 1,45,150. Silver has support at Rs. 2,20,000 and Rs. 2,16,600 and resistance at Rs. 2,26,600 and Rs. 2,30,000.

    Market participants will continue to monitor developments in the Middle East and any new signals from the Federal Reserve regarding the timing of policy tightening, which could further influence precious metal prices.

  • Nifty50 Crosses 24,000 Mark, Sensex Gains 447 Points in Positive Session

    Nifty50 Crosses 24,000 Mark, Sensex Gains 447 Points in Positive Session

    The Indian stock market extended its winning streak on Thursday, July 9, 2026, with both the Nifty50 and Sensex posting strong gains. The Nifty50 climbed 147.05 points to close at 24,029.10, while the Sensex rose 447.14 points to 76,950.74. The rally was driven by robust buying in consumer durables and auto stocks, despite global uncertainties stemming from fresh tensions between the United States and Iran.

    Consumer Durables and Auto Stocks Lead the Rally

    Consumer durables emerged as the strongest sector, with significant buying interest. Auto stocks also performed well, providing solid support to the benchmark indices. The strength in these sectors helped balance weakness in other parts of the market, particularly the IT sector.

    Top Gainers and Broader Market Performance

    Bharti Airtel, Sun Pharmaceutical Industries, and Eternal led the gains among large-cap stocks. The broader market outperformed, with the Nifty MidCap rising 1.14% and the Nifty SmallCap gaining 1.5%, indicating widespread investor confidence beyond just large-cap names.

    Mixed Sector Performance

    The Nifty Consumer Durables recorded the highest gain among sectoral indices, while the Nifty IT remained under pressure. However, the strength in consumer durables and auto stocks outweighed the weakness in IT.

    Global Developments and IPO Activity

    Traders monitored US-Iran tensions, but domestic buying helped offset global headwinds. In the primary market, several IPOs attracted attention: Laser Power & Infra (₹742 crore), Devson Catalyst (₹42.32 crore), and Happy Steels (₹25 crore) opened for subscription, while the Kusumgar IPO (₹650 crore) entered its second day.

    Market Outlook

    With the Nifty50 holding above 24,000 and Sensex near 77,000, positive momentum is expected to continue if global conditions remain stable. Investors are advised to keep an eye on sector-specific movements and upcoming IPO progress.

  • Kalyan Jewellers Stock Surges 24% in Two Days: Hits Rs 438.15 on Strong Q1 Update and Citi Buy Rating

    Kalyan Jewellers Stock Surges 24% in Two Days: Hits Rs 438.15 on Strong Q1 Update and Citi Buy Rating

    Overview

    Kalyan Jewellers shares staged a remarkable comeback on Dalal Street, surging nearly 24% over the past two trading sessions after the jewelry retailer reported a robust first-quarter business update and received a strong endorsement from global brokerage Citi. The stock is currently trading at Rs. 438.15 on the NSE, up Rs. 81.84 or 22.98%, after hitting the upper circuit, reflecting renewed investor confidence in the company’s growth prospects.

    This rally is the result of a positive market response following the company’s robust revenue growth, not just at home but abroad as well, and strong performance from its online jewelry store, Candere. This was further supported by Citigroup’s decision to reiterate its ‘Buy’ rating with a target price of Rs. 750.

    Strong Q1 Business Performance

    Kalyan Jewellers provided a solid start to the financial year FY27, posting consolidated revenue growth of around 38% year-on-year during the quarter ending June. Revenue growth was driven by strong demand in the Indian market, despite seasonal factors affecting jewelry purchases.

    Domestic sales were the key contributor to revenue growth, with about 38% growth compared to the previous year. Existing stores delivered strong performance with same-store sales growth of 28%. International operations performed well during the period, with nearly 35% year-on-year growth, while the company’s Middle East business grew 30% year-on-year. International markets accounted for 14% of total consolidated revenue.

    The Kalyan Jewelers’ online jewelry brand, Candere, showed a 112% year-on-year revenue growth. The retailer also accelerated its expansion strategy during the quarter by opening 12 new Kalyan Jewellers showrooms and 5 new Candere outlets, expanding its retail presence into more cities across the country.

    Citi Maintains Bullish View

    Global brokerage Citi remained optimistic on Kalyan Jewellers despite the company’s revenue growth coming in slightly below its internal estimate of around 45%. Maintaining a ‘Buy’ rating, the brokerage reiterated its target price of Rs. 750, implying substantial upside from prevailing levels.

    Citi believes that the company’s brand-based expansion strategy will generate earnings growth while keeping capital expenditure in check. Moreover, analysts expect improvement in operational efficiencies and better returns on investment as the company grows.

    Factors Driving the Rally

    According to management, demand has been encouraging at the start of the second quarter, buoyed by festive purchases and the upcoming wedding season. Analysts feel that branded jewelry players like Kalyan Jewellers are well-placed to capitalize on consumers’ growing preference for brands that offer fair pricing and certified jewelry.

    Despite volatile gold prices and competition, robust sales growth, increased retail presence, and improved digital performance will be the key factors sustaining an encouraging outlook for the company. With excellent operations, strong growth, and bullish brokerage reports, Kalyan Jewellers is expected to remain in the spotlight until it reports its quarterly results.

  • FTSE 100 Slips to 10,441 as AstraZeneca Tumbles on Drug Trial Failure; Brent Drops 1.23%

    FTSE 100 Slips to 10,441 as AstraZeneca Tumbles on Drug Trial Failure; Brent Drops 1.23%

    Market Overview

    The FTSE 100 fell 47.61 points to trade at 10,441.44 on Thursday, dragged by a sharp decline in AstraZeneca following disappointing late-stage trial results for its experimental heart drug. Escalating tensions in the Middle East also weighed on sentiment. Meanwhile, Brent crude futures dropped 1.23% to $76.06 per barrel, while US West Texas Intermediate (WTI) lost 1.14% to settle at $72.68.

    Sterling strengthened against the dollar, quoted at $1.3406 early Thursday, up from $1.3358 at the previous close. However, sterling weakened against the euro, trading at €1.1721 compared to €1.1722 a day earlier.

    Gainers and Losers

    Top Gainers:

    • Computacenter surged 10.88% to £4,586 after forecasting a sharp profit increase for the first half of 2026.
    • Antofagasta advanced 3.97% to £3,667.
    • Glencore rose 3.72% to £508.90.
    • Anglo American gained 3.37% to £3,495.
    • Standard Chartered added 2.65% to £2,090.
    • Endeavour Mining climbed 2.33% to £3,645.

    Top Losers:

    • AstraZeneca plunged 9.65% to £12,866 after its nerve disease drug Wainua failed a late-stage trial.
    • Coca-Cola Europacific Partners slipped 1.25% to £7,890.
    • British American Tobacco fell 1.97% to £4,520.
    • Unilever dropped 1.23% to £4,582.50.
    • London Stock Exchange Group declined 0.47% to £8,820.
    • Reckitt Benckiser eased 0.83% to £5,024.

    AstraZeneca Stock Tumbles on Drug Trial Failure

    Pharma heavyweight AstraZeneca saw shares fall 8.4% in early trade to £13,043.48 after the company announced that its nerve disease drug Wainua, developed in partnership with US-based Ionis, failed to meet its primary endpoint in a late-stage trial. The drug was intended to reduce cardiovascular deaths and recurring heart problems in patients with a type of heart disease characterized by protein buildup that disrupts blood pumping.

    Brooks Macdonald Ends Fees on Uninvested Cash

    Investment manager Brooks Macdonald has scrapped cash fees on discretionary portfolios, effective 1 July, amid intensifying regulatory scrutiny from the Financial Conduct Authority (FCA) over so-called ‘double-dipping’ practices. The move follows a similar decision by Rathbones, which acknowledged that halting such fees would reduce its pre-tax profit by £9 million. Brooks Macdonald also reported a turnaround in net inflows for the financial year, reaching £226 million, compared with outflows of £396 million the prior year.

    Computacenter Expects First-Half Profit to Double

    Computacenter said it expects adjusted profit before tax for the first half of 2026 to be approximately double the £81.5 million recorded in the same period last year. The IT services firm attributed the upbeat outlook to stronger-than-expected second-quarter performance and indicated that full-year results would comfortably beat market expectations, though it remained cautious about a tougher comparative in the second half.

    Global Market Update

    In the US, the Dow Jones fell 1.1% and the S&P 500 declined 0.3%, while a rally in select AI stocks helped the Nasdaq advance 0.2%. In Asia on Thursday, Japan’s Nikkei 225 rose 1.51% to 67,830.79, China’s Shanghai Composite gained 1.1%, Hong Kong’s Hang Seng fell 0.69%, and Australia’s S&P/ASX 200 slipped 0.26%. India’s Nifty 50 and Sensex declined 0.71% and 0.79%, respectively.

    Disclaimer: This article is for informational purposes only and does not constitute investment advice. Readers should conduct their own research before making any investment decisions.

  • S&P 500 and NASDAQ Dip as Oil Surges on Trump’s Iran Warning

    S&P 500 and NASDAQ Dip as Oil Surges on Trump’s Iran Warning

    Wall Street moved lower on Wednesday after President Donald Trump declared the interim US-Iran accord ‘over,’ reigniting fears of conflict near a critical global energy route. The Dow Jones Industrial Average fell roughly 1.5%, the S&P 500 dropped 0.7%, and the NASDAQ Composite declined 0.8% by late morning trading.

    The market reaction was notable but orderly. Oil prices spiked sharply, Treasury yields climbed, and investors rotated away from travel and consumer stocks. However, gains in chip and energy shares helped cushion the broader decline across major indices.

    Stocks Fall, But Losses Stay Contained

    US equities opened under pressure after Trump said he had no interest in further talks with Iran and warned of possible additional US strikes. The comments followed renewed attacks tied to the Strait of Hormuz, a key waterway for global oil flows.

    Despite the tension, the selloff remained narrower than a full risk-off event. At 11:30 a.m. ET, the Dow was down 810 points to 52,115. The S&P 500 slipped to 7,431, while the NASDAQ fell to 25,565. Decliners outpaced advancers on both the NYSE and NASDAQ, signaling broad caution.

    Oil Jumps as Hormuz Risks Return

    Oil prices delivered the clearest market reaction to Trump’s remarks. Brent and US West Texas Intermediate crude both surged more than 5% as traders reassessed supply risks from the Gulf region.

    The move was not worse because traders had already priced in months of Middle East disruption. Some investors also waited to see whether shipping through the Strait of Hormuz would face a fresh full blockade. Fiona Cincotta of City Index captured this caution, saying, “This was always a very fragile peace process.”

    Chip Gains Cushion NASDAQ

    Technology stocks offered partial support, mainly through chipmakers. Broadcom rose after Apple announced plans to spend more than $30 billion under a chip-supply agreement with the company. This gain helped ease pressure on the NASDAQ, which has faced recent volatility.

    The Philadelphia SE Semiconductor Index also advanced, while energy was one of the few S&P 500 sectors in positive territory. Nine of the 11 main S&P 500 sectors traded lower. Travel shares weakened as higher fuel prices raised cost concerns for airlines and cruise operators.

    Investors Watch Fed Minutes

    The timing added another layer for markets, with the Federal Reserve set to release minutes from its June policy meeting at 2 p.m. ET. The meeting was the first under Chair Kevin Warsh, who has shifted away from forward guidance and kept rates unchanged at 3.50% to 3.75%.

    Higher oil prices brought inflation risk back into focus before the release. Ian Lyngen of BMO Capital Markets said June core inflation figures could draw less attention if crude keeps moving higher in July. He added that the Fed minutes may look “somewhat stale” after the latest Middle East turn.

    Doubts Keep the Reaction Measured

    Analysts pointed to uncertainty rather than a single clear market path. Matthew Ryan of Ebury said ‘the million-dollar question’ was whether talks had fully broken down or only hit a temporary setback. This doubt helped explain why stocks fell but did not collapse.

    Meanwhile, the International Monetary Fund lowered its 2026 global growth forecast to 3.0% and cited war-related energy risks. The update gave investors another reason to watch oil, inflation, and central bank policy closely, while markets waited for clearer signs on Iran, shipping flows, and Fed thinking.

  • Top Telecom Expense Management Solutions for Enterprises in 2026

    Top Telecom Expense Management Solutions for Enterprises in 2026

    Telecom expense management (TEM) is critical for businesses to control communication costs, automate billing, and gain full visibility into their telecom inventory. As we look ahead to 2026, several companies stand out for their comprehensive solutions. Below are the leading TEM providers that help enterprises optimize expenses and streamline operations.

    Tangoe

    Tangoe automates telecom inventory management, invoice processing, and expense optimization. It helps enterprises reduce unnecessary communication costs and improve visibility across their telecom assets.

    Calero

    Calero offers end-to-end telecom lifecycle management with expense tracking, contract optimization, and analytics tailored for global enterprise communication infrastructure.

    Sakon

    Sakon simplifies telecom expense management through automated billing validation, procurement, inventory management, and mobile device lifecycle administration.

    Cass Information Systems

    Cass Information Systems provides telecom invoice auditing, payment processing, reporting, and expense control for organizations managing complex communication networks.

    Brightfin

    Brightfin integrates telecom expense management with IT asset management, delivering centralized visibility across devices, carriers, and software subscriptions.

    MDSL

    MDSL helps multinational enterprises optimize telecom spending using advanced analytics, inventory tracking, contract management, and automated invoice validation.

    Valicom Clearview

    Valicom Clearview delivers telecom auditing, wireless management, expense optimization, and procurement services that improve financial accountability across organizations.

    Avotus

    Avotus supports telecom expense management through inventory control, contract tracking, billing automation, and customizable enterprise reporting dashboards.

    WidePoint

    WidePoint combines mobility management, telecom expense optimization, and cybersecurity solutions to help businesses securely control communication expenses.

  • Indian Stock Market Update: Nifty 50 Targets 24,600, Sensex Holds 77,700 Amid Mounting US-Iran Tensions

    Indian Stock Market Update: Nifty 50 Targets 24,600, Sensex Holds 77,700 Amid Mounting US-Iran Tensions

    The Indian stock markets are poised for a lower open on Wednesday after fresh US strikes on Iran following drone attacks on commercial vessels in the Strait of Hormuz. GIFT Nifty futures are trading at 24,239.5, reflecting a discount of 144 points from the previous Nifty futures close, signaling a gap-down start.

    On Tuesday, late profit-booking erased early gains, pulling the Sensex down 104.35 points to settle at 78,180.72, while the Nifty 50 slipped 0.13% to close just below the 24,400 mark. Mid-cap and small-cap indices faced heavier selling, dropping 0.4% and 0.55% respectively. Foreign institutional investors bought a net Rs 393.19 crore in cash markets, nearly offsetting the Rs 383.43 crore sold by domestic institutions.

    Sensex Outlook

    Technically, the Sensex formed a bearish candle on the daily chart, indicating potential further weakness. Shrikant Chouhan, Head of Equity Research at Kotak Securities, said,

    “For day traders, 77,700 will act as a crucial support zone. Above these levels, Sensex could retest 78,400-78,600. On the flip side, if the index falls below 77,700, it could witness a sharp intraday dip towards 77,400-77,100.”

    Nifty 50 Outlook

    The Nifty 50 has entered a consolidation phase after a rally of nearly 1,500 points over the past five weeks. Bajaj Broking Research noted,

    “We believe the overall structure is positive, and dips towards the 24,200-24,000 should be used to accumulate quality stocks in a staggered manner. On the higher side, only a sustained move above 24,600 will signal extended gains towards 24,800 levels, being the trendline resistance joining the previous major breakdown area.”

    The brokerage expects Nifty to trade within the 24,200-24,600 range in the coming sessions. A decisive breakout above 24,600 could pave the way for 24,800, while the 24,200-24,000 zone is likely to act as key support.

    Bank Nifty Outlook

    On Tuesday, Bank Nifty declined 90.80 points or 0.16% to close at 58,200.70, forming a bearish candle on the daily chart. Bajaj Broking said,

    “A decisive move above the recent swing high of 58,700 will strengthen the bullish setup and can pave the way for an advance towards 59,200 and 60,000 in the coming weeks, which coincide with the 138.2% and 150% external retracement of the previous decline from 57,456 to 52,783. Failure to move above 58,700 will signal extension of the last 8 sessions’ consolidation in the range of 57,000-58,700.”

    Disclaimer: This article is for informational purposes only and does not constitute investment advice. The stocks and cryptocurrencies mentioned involve risk. Conduct your own research before making any investment decisions.