Category: Finance

  • Why Strategic Partnerships Are Now Essential for Fintech Growth

    Why Strategic Partnerships Are Now Essential for Fintech Growth

    Building a fintech company from the ground up rarely guarantees lasting success anymore. Regulatory complexity, infrastructure costs, and customer trust all demand resources that few startups hold alone. Partnerships have become the practical route to solving these gaps quickly.

    Industry data now supports what many founders have sensed intuitively for years. Firms combining fintech innovation with institutional backing tend to scale faster than those working in isolation. What began as a survival tactic has turned into a defining growth strategy across the sector.

    Legacy infrastructure, tighter regulation, and rising customer expectations pushed both sides closer together. KPMG International’s recent research, drawn from 1,000 banking and retail executives, confirms that strategic partnerships now drive measurable growth across the sector. Collaboration has stopped being a defensive move and started functioning as a core strategy.

    Why Strategic Partnerships Matter in Fintech

    Strategic partnerships solve problems that banks and fintechs cannot fix independently. Banks carry legacy systems that resist quick innovation cycles. Fintechs often lack licensing, capital reserves, and the institutional trust banks have built over time. Combining these strengths speeds up product development considerably.

    It also widens market reach for both parties involved. Leading firms increasingly treat partnerships as core infrastructure rather than optional pilot projects. Neobanks, in particular, reported the highest share of modernization leaders among banking respondents surveyed. This pattern suggests newer institutions adapt faster when partnerships anchor their strategy.

    The Funding Connection

    Strategic alliances also work as a genuine funding lever for growth. Quebec fintechs raised $428.4 million CAD across twelve funding rounds during a recent year. This figure represented 27% of Canada’s total fintech investment that same year.

    Partnership-backed ventures tend to attract capital more efficiently than standalone startups working alone. Co-investment models reinforce this trend across multiple markets. The Citi-Carlyle fintech funding initiative shows how institutions and fintechs pool resources together. Together, they scale faster than either party could manage separately.

    Fintech Partnership Models

    Different partnership structures serve different strategic goals within the industry. Choosing the right model affects scalability, compliance load, and speed to market significantly.

    Each model carries tradeoffs worth weighing carefully before committing. Referral partnerships scale quickly but offer limited long-term differentiation. Hybrid partnerships demand stronger governance structures from both parties. In return, they unlock the greatest long-term value for banks and fintechs alike.

    Payments Push Collaboration Further

    Payments infrastructure shows clearly why partnerships have become unavoidable industry practice. Banks spent an average of $96.9 million on payment modernization last fiscal year alone. Full-service and corporate banks each allocated over $150 million toward these initiatives.

    KPMG’s Geoff Rush, Global Head of Banking and Capital Markets, said payments now depend on ecosystems linking banks, fintechs, retailers, and technology firms together. Banks increasingly orchestrate services rather than acting as sole providers themselves. This orchestration role represents a meaningful shift in how banks define their market position.

    Fifty-four percent of retailers see payment modernization as essential to their business future. Only 53% believe their banking partners fully understand their modernization goals clearly. This gap leaves considerable room for closer alignment going forward. Artificial intelligence adds further urgency, with 85% of banks planning to use it for instant fraud risk resolution within three years.

    What Separates Lasting Partnerships From Failed Ones

    Several factors consistently decide whether fintech partnerships survive long-term:

    • Early alignment on risk tolerance between fintechs and banks
    • Clear governance defining decision rights and escalation paths
    • Automated onboarding and compliance through partner management platforms
    • Ongoing performance evaluation against shared, predefined metrics
    • Genuine willingness to share data and technical resources openly

    Misaligned risk appetite remains the most common failure point across the industry. Fintechs generally favor faster iteration and bold experimentation with new products. Banks prioritize stability and regulatory caution instead, given their exposure to systemic risk. Without early workshops to set shared protocols, promising collaborations often stall before launch or fail.

    Final Words

    Strategic partnerships have moved past being a competitive advantage for a select few. They now function as standard practice across fintech and banking globally. Institutions treating collaboration as a long-term asset consistently outperform those still operating in isolation from the broader ecosystem.

    The data support this conclusion clearly and consistently. Capital flows faster toward partnership-backed ventures across nearly every market studied. Payment modernization budgets keep climbing across the industry year after year. More than half of banks already expect ecosystem strength to determine tomorrow’s winners in this space. Companies willing to share expertise, technology, and risk will likely lead the next wave of change in financial services.

  • Foreign Investors Pour Rs 15,157 Crore Into Indian Stocks in July, Ending Four-Month Sell-Off

    Foreign Investors Pour Rs 15,157 Crore Into Indian Stocks in July, Ending Four-Month Sell-Off

    Foreign portfolio investors (FPIs) have staged a sharp turnaround in July, investing Rs 15,157 crore in Indian equities after four consecutive months of net selling. The inflow has infused fresh optimism into the market, signaling that overseas investors may be regaining confidence in India’s growth story.

    According to data, the July influx follows heavy withdrawals over the previous months: Rs 49,340 crore in June, Rs 32,963 crore in May, Rs 60,847 crore in April, and a massive Rs 1.17 lakh crore in March. Before that, FPIs had invested Rs 22,615 crore in February.

    Himanshu Srivastava, Principal Manager, Research at Morningstar Investment Research India, noted that after a phase of market consolidation, valuations have become more reasonable, encouraging foreign investors to selectively increase exposure to fundamentally strong Indian companies.

    Most of the July investment has flowed into large-cap stocks, particularly banks, financial institutions, and other major businesses. These stocks are preferred by foreign investors for their liquidity and ease of trading in large volumes.

    While the return of FPI money has boosted market confidence, the real story may extend beyond large caps. Midcap and smallcap stocks have rallied strongly over the past year, and fresh foreign inflows could help sustain the broader uptrend—provided investor confidence remains robust. However, valuations in some segments of the mid- and small-cap space are already elevated, making them vulnerable to earnings disappointments or shifts in global conditions.

    The crucial question is whether this represents a genuine long-term return or a tactical short-term trade. Some buying may be driven by portfolio rebalancing or global liquidity flows rather than a fundamental shift in sentiment. Nevertheless, India’s long-term growth prospects continue to attract attention. One strong month does not guarantee a sustained recovery, but it offers an encouraging sign. The coming months will reveal whether foreign investors are back for the long haul or merely exploiting a short-term opportunity.

  • 7 High-Growth US Tech Stocks to Watch in 2026: Key Drivers and Risks

    7 High-Growth US Tech Stocks to Watch in 2026: Key Drivers and Risks

    The US technology sector continues to be shaped by artificial intelligence, cloud software, and semiconductor innovation. Companies delivering consistent revenue and earnings growth remain in focus. These high-growth tech stocks stand out for their strong business momentum and long-term potential.

    Overview

    Seven US tech companies posted verified double- or triple-digit revenue growth in their most recent 2026 quarterly reports. Each stock carries a distinct growth driver, from AI infrastructure demand to NAND storage contracts, rather than a repeated AI narrative. Every pick comes with a specific, company-disclosed risk factor investors should track before buying.

    Revenue separates market leaders from market stories. The strongest US tech companies are proving their growth through earnings rather than expectations. From AI infrastructure to cybersecurity and digital commerce, these seven stocks are backed by measurable performance instead of market hype.

    NVIDIA Stock: Why it Remains a Top High-Growth AI Stock in 2026

    NVIDIA posted first-quarter fiscal 2027 revenue of $81.6 billion, up 85% year over year, with data center revenue up 92%. The Blackwell ramp is still driving that growth, and the Rubin platform is set to contribute revenue for the first time next quarter. The clearest risk sits in the guidance itself: NVIDIA is assuming zero data center compute revenue from China going forward, a quantified exposure rather than a vague valuation concern.

    Palantir Stock: Enterprise AI Growth Makes it a Top Tech Stock in 2026

    Palantir grew revenue 85% year over year in Q1 2026, its fastest pace since 2020, with US commercial revenue up 133%. The company raised its full-year guidance to 71% growth and reported a Rule of 40 score of 145. Operating expenses rose 32% in the same quarter, so any slowdown in commercial deal velocity would hit margins faster than revenue could offset it.

    Shopify Stock: Commerce Growth and AI Innovation Drive 2026 Performance

    Shopify crossed $100 billion in quarterly GMV for the second straight quarter, with revenue up 34%. The Universal Commerce Protocol, now backed by Amazon, Meta, Microsoft, Salesforce, and Stripe, is the structural story here. Investors should still note that the stock fell 8.7% on the print itself, as rising transaction losses and a price-to-earnings ratio near 135 offset the headline growth.

    Zscaler Stock: Cybersecurity Growth Powered by AI Demand

    Zscaler grew revenue 25% and ARR 25% in its third fiscal quarter, positioning itself as the cybersecurity layer for AI agents. Strip out the Red Canary acquisition, and organic ARR growth drops to 21%, and the company’s own early guidance for fiscal 2027 points to a step down to 16 to 17% growth.

    HubSpot Stock: AI-Powered CRM Growth Supports Long-Term Potential

    HubSpot grew revenue 23% in Q1 2026, with total customers approaching 300,000 and active AI seat users up 90% year over year. The company’s push into agentic tools, including its new Customer, Prospecting, and Data Agents, is driving upmarket deal sizes higher, with deals above $120,000 in ARR up 64%. But pricing and go-to-market changes made in April slowed sales capacity, and management has already guided Q2 growth down to 18%. That is a declaration the company disclosed itself, not a market guess.

    SanDisk Stock: AI-Driven NAND Demand Fuels Revenue Growth

    Revenue more than tripled to $5.95 billion as AI workloads drove NAND demand, and the company locked in $42 billion of long-term supply contracts covering a third of its fiscal 2027 bit shipments. Management has flagged the risk directly: the variable-priced portions of those contracts could erode margins fast if NAND supply outpaces demand.

    Reddit Stock: Advertising and AI Data Licensing Drive Growth

    Reddit rounds out the list with a genuinely different growth driver. Revenue grew 69% in Q1 2026, its seventh straight quarter above 60% growth, powered by advertising revenue up 74% and a data licensing relationship with AI model builders built on more than 25 billion posts and comments. Active advertisers on the platform grew more than 75% year over year, and the company’s own automated campaign product, Reddit Max, is already showing measurable results for advertisers. The gap to watch: US daily active users sit at 53.5 million, approximately half of management’s own stated target of 100 million.

    What is Driving High-Growth US Tech Stocks in 2026?

    None of these seven stocks is growing for the same reason. NVIDIA and SanDisk are riding AI infrastructure demand from opposite ends of the supply chain. Palantir and HubSpot are monetizing AI inside enterprise software. Shopify is building a two-decade-old commerce network. Zscaler is selling security for a threat landscape that did not exist five years ago. Reddit is turning its content archive into a licensing asset.

    Final Thoughts

    Every stock on this list beat growth expectations this year, and every one of them also handed investors a specific reason to stay disciplined. The market has stopped rewarding growth on its own; it now waits to see whether a China exposure, a slowing organic ARR line, or a guided deceleration actually shows up in the next print. The companies that manage their own disclosed risk will separate from the ones that only manage the headline. Watch the risk column as closely as the growth column, because that is where the real verdict gets written.

  • Top Credit Cards for Online Shopping in India (2026 Edition)

    Top Credit Cards for Online Shopping in India (2026 Edition)

    Online shopping credit cards allow users to earn cashback, rewards, and exclusive discounts on everyday purchases across popular e-commerce platforms. Choosing the right card can significantly boost your savings on digital transactions.

    Amazon Pay ICICI Credit Card

    This card offers attractive cashback, lifetime free membership, and extra savings for frequent Amazon shoppers. It is ideal for those who primarily shop on Amazon India.

    Flipkart Axis Bank Credit Card

    Designed for Flipkart enthusiasts, this card provides cashback on Flipkart purchases, partner brands, and exciting discounts during festive shopping sales.

    HDFC Millennia Credit Card

    HDFC Millennia rewards online spending across shopping, travel, food delivery, and entertainment platforms with cashback benefits, making it a versatile choice for everyday use.

    SBI Cashback Credit Card

    The SBI Cashback Credit Card offers cashback on eligible online transactions across multiple merchants without restricting rewards to one platform, giving you flexibility.

    Axis Bank ACE Credit Card

    This card combines cashback on online shopping, utility bill payments, and selected partner merchant transactions, making it a strong all-rounder.

    How to Choose the Right Card

    Compare annual fees, cashback rates, reward limits, and your spending habits before selecting a card. Always pay credit card bills on time to avoid interest charges and maintain a healthy credit score. The right credit card can maximize savings while making online shopping more rewarding, convenient, and financially beneficial in 2026.

  • Amazon’s $25B AI Bond Sale Signals Shift in Tech Debt Markets: Abishai Financial Asia Analysis

    Amazon’s $25B AI Bond Sale Signals Shift in Tech Debt Markets: Abishai Financial Asia Analysis

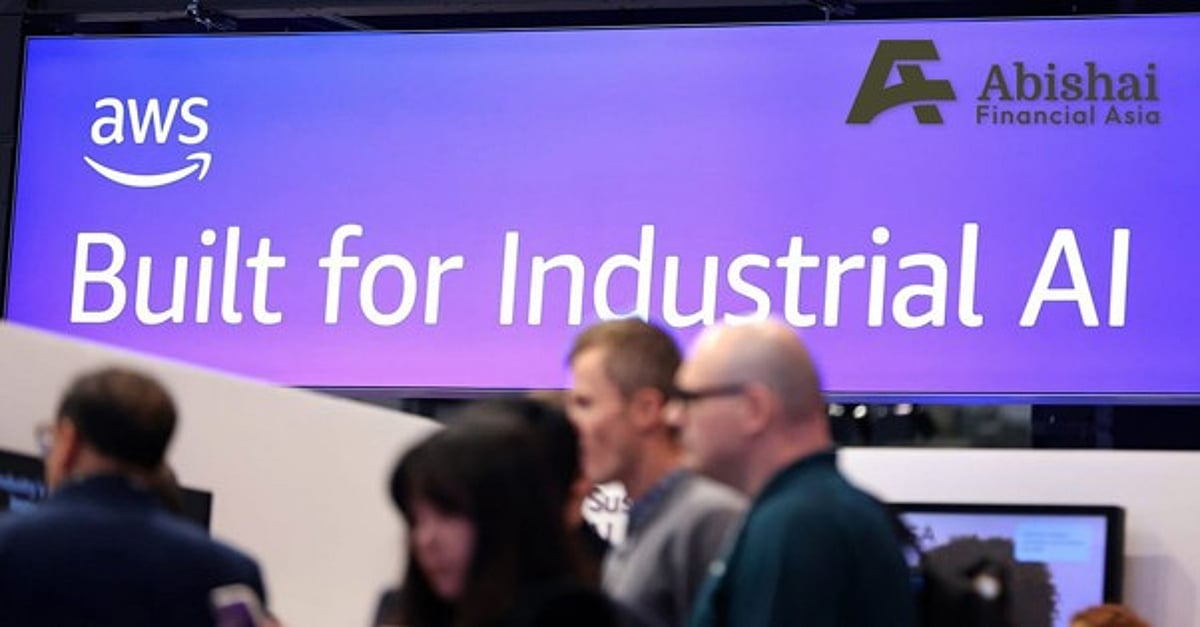
    A surprise $25 billion bond offering from Amazon has pushed artificial intelligence-related borrowing toward $270 billion, yet thinning order books, wider yield concessions, and shrinking free cash flow expose how heavily the cloud giants now rely on the bond market.

    The sale, characterized by Bank of America as a surprise transaction, lifts Amazon’s total borrowing to $92 billion over recent months. Across the broader market, AI-related debt now stands at approximately $270 billion over the same period—nearly double the $136 billion issued in all of the previous year. Hyperscaler bonds account for an estimated $194 billion of that total, and Abishai Financial Asia views the sale as a marker of how sharply the sector’s funding needs have shifted.

    This offering comes only months after an earlier $37 billion deal, an interval Bank of America considers unusually compressed. Amazon has signaled to underwriters that it intends no further issuance in the near term. Order books closed at 2.5 times the amount offered, down from 3.2 times on the earlier deal and the softest cover for any hyperscaler since a comparable $30 billion sale from Meta late last year. To attract buyers to maturities as long as 40 years, Amazon conceded 18 to 21 basis points above comparable securities.

    The individual deal sits within a broader repricing of technology credit. Morgan Stanley expects annual AI-related issuance to rise to $570 billion. Daniel Coventry, Director of Private Equity at Morgan Stanley, described a sector that has “moved decisively beyond operating cash flow and into the bond market as a standing source of finance,” a shift he believes warrants closer monitoring of aggregate exposure budgets. The five largest hyperscalers have together raised $121 billion in US corporate bonds over the past year, compared to an annual average of $28 billion across the preceding four years—a 332% increase.

    Amazon’s reliance on debt reflects an equally rapid rise in spending. Web Services revenue reached $35.6 billion in the most recent quarter, a 24% increase year-over-year. CEO Andy Jassy stated publicly that the division faces greater demand than it can currently supply, with chip availability the binding constraint, even as the group directs $43.2 billion toward cloud and generative AI capacity in the opening quarter alone. Committed capital expenditure now stands at $200 billion, while trailing free cash flow has contracted to $1.2 billion from $25.9 billion a year earlier. Capital spending now absorbs 94.5% of operating cash flow.

    Comparable pressures run across the sector. Oracle has raised $27.7 billion over the past year, and Meta recently arranged a $27 billion private credit facility with Blue Owl to fund a data center campus in Louisiana. Alphabet has placed the first 100-year bond from a technology issuer in decades. S&P Global warns that credit quality faces erosion should the anticipated recovery in cash flow fail to materialize. With Oracle already carrying a BBB rating on a negative outlook, Coventry observed that “an investment grade label alone is no longer a sufficient guide to the risk embedded in these balance sheets.”

    The strain reflects a widening gap between what cloud providers earn and what they spend. The five largest are on course to commit some $750 billion to capital expenditure—equivalent to 38% of revenue—and set to approach $1 trillion within four years. Quarterly operating cash flow of $26 billion sits against outlays of $44.2 billion. Rate expectations offer only a partial offset, with global investment grade credit currently yielding around 4.4%. Coventry maintains that “disciplined exposure management, rather than passive reliance on a rating, is the more defensible posture while issuance continues at this pace.”

    Set against secondary markets where roughly $50 trillion of US corporate bonds trades barely $43.5 billion on an average day, the build-out leaves institutional investors weighing resilience as closely as return. Hedging through credit default swaps has climbed sharply in recent quarters, even as secondary depth in the newest paper stays thin. Widening yield premiums and thinning cover point to a durable change in how that risk is priced, one that rewards active management of single issuer limits over confidence in a rating alone. Abishai Financial Asia reads the present wave of infrastructure-led issuance as a test of capital discipline that is only beginning.

    About Abishai Financial Asia

    Abishai Financial Asia Pte. Ltd. (UEN 201016239E) is a Singapore-based asset manager and research-led partner in capital allocation. Its approach compounds capital in public markets through active equity selection, bottom-up research, and disciplined rebalancing, supported by overlay tools such as systematic tilts, opportunistic hedging, and drawdown-aware controls. Governance rests on macro-aware risk budgeting, with explicit limits, concentration and liquidity guardrails, stress testing, and transparent attribution. Environmental, social, and governance factors are embedded wherever financially material. The firm is exploring compliant structures that could, subject to suitability, extend selected solutions to retail qualified investors over time. Further information is available at https://abishai.com; media enquiries may be directed to Peng Joon at p.joon@abishai.com.

  • DMart Q1 Revenue Rises 14.9% as Margin Squeeze Persists Amid Higher Costs

    DMart Q1 Revenue Rises 14.9% as Margin Squeeze Persists Amid Higher Costs

    DMart, operated by Avenue Supermarts, has reported its first-quarter results for fiscal year 2027, revealing steady revenue growth driven by increased footfall. However, rising operational expenses continue to pressure profit margins, reflecting broader challenges faced by the retail sector.

    Consolidated revenue for the quarter reached Rs. 18,794.5 crore, a 14.9% increase year-over-year. Total expenses climbed to Rs. 17,637.2 crore from Rs. 15,321.7 crore in the same period last year. The company’s managing director, Anshul Asawa, noted that stores open for two years or more saw same-store sales growth of 5.5% in Q1 FY27, down from 7.1% in Q1 FY26.

    Food and grocery items accounted for 54.9% of total revenue, a slight decline from 55.6% a year ago, while general merchandise and apparel contributed 25.5%, up from 24.7%. The results indicate that DMart continues to attract shoppers despite intense competition from online grocery platforms like Zepto and Instamart, as well as traditional retailers.

    Higher employee costs, store maintenance expenses, and general inflation are eating into margins. DMart’s strategy of offering low prices makes it difficult to pass on cost increases to customers. The company’s ability to maintain profitability while expanding its store network will be closely watched by investors in the coming quarters.

    These results underscore a broader trend in India’s retail market: consumers are spending cautiously, and retailers must balance cost control with competitive pricing in an environment of rising expenses and shifting shopping habits toward online and quick-delivery services.

  • Razorpay vs PayU vs Cashfree: The Ultimate Payment Gateway Comparison for 2026

    Razorpay vs PayU vs Cashfree: The Ultimate Payment Gateway Comparison for 2026

    Choosing the right payment gateway is more than a technical decision—it directly impacts your customer experience, settlement speed, and long-term business growth. As we look ahead to 2026, three major Indian payment gateways stand out: Razorpay, PayU, and Cashfree. Each offers distinct strengths, making the best choice dependent on your specific business needs rather than just transaction fees.

    What Really Matters in a Payment Gateway

    Four key factors set these gateways apart: pricing, settlement speed, features, and developer experience. While transaction fees are important, integration quality, recurring billing support, payout capabilities, and payment success rates often have a greater impact on your bottom line. A low fee is attractive, but delayed settlements or poor operational support can quietly increase your costs over time.

    At a Glance

    This comparison focuses on pricing, settlement cycles, integrations, and business capabilities specific to India’s market, helping merchants make an informed decision for 2026.

    Payment Methods and Integrations

    All three gateways support UPI, credit and debit cards, net banking, and digital wallets. The real differences lie in advanced features:

    • Razorpay and Cashfree offer UPI AutoPay for recurring payments, payment links, and seamless integrations with Shopify, WooCommerce, and Magento.
    • PayU excels in international payments, with strong EMI and Buy Now Pay Later support, plus a broader range of global payment options.

    Security is consistent across all three: PCI DSS compliant, with fraud detection and tokenization.

    Razorpay: Broad Ecosystem, Transparent Pricing

    Razorpay charges a flat 2% + 18% GST on most domestic transactions (cards, UPI, net banking, wallets). Premium methods like EMI, corporate cards, and Amex/Diners cost 3% + GST. There are no setup or annual fees under the standard plan. Domestic settlements run on a T+2 cycle; international settlements take T+7. Note that UPI transactions may have zero MDR under government regulation, but platform fees can still apply.

    Razorpay stands out for subscription tooling, UPI AutoPay, and fast integration—ideal for SaaS and D2C businesses. High-volume merchants (above ~Rs. 50 lakh/month) can negotiate custom rates. Its dashboard provides success-rate breakdowns by payment method and issuing bank, helping diagnose failed transactions.

    PayU: Enterprise Scale, Negotiated Pricing

    PayU does not publish a standard rate card. Independent sources typically cite domestic pricing around 2% for cards, net banking, BNPL, and wallets, rising to ~3% for Amex, Diners, EMI, and international transactions. UPI fees can be negotiated below 1% at higher volumes. This approach offers flexibility for merchants with negotiating leverage.

    PayU’s value at scale comes from dedicated account management, established chargeback handling, and cross-border infrastructure supporting over 150 payment methods globally. The trade-offs include a longer onboarding process with more documentation and a merchant dashboard that users rate lower than Razorpay’s in usability.

    Cashfree: Lower Published Rate, Stronger Payouts

    Cashfree’s standard rate is 1.95% across payment modes for auto-activated merchants—slightly undercutting Razorpay’s published TDR. Setup and integration are free. Settlement follows the same T+2 default, with instant settlement available within 15 minutes for an additional charge.

    Cashfree’s primary differentiator is its payout infrastructure, widely recognized as best-in-class for marketplace and vendor disbursement workflows. Merchants should confirm current promotional pricing and any annual fees directly with Cashfree’s sales team, as some third-party sources report a fixed annual charge not listed in their public FAQ.

    Which Payment Gateway Suits Your Business?

    Subscriptions and Recurring Billing

    Razorpay is the stronger choice for subscription-driven and SaaS businesses. Its UPI AutoPay support and fast integration make it the most complete option for recurring billing.

    Vendor Payouts and Marketplace Settlements

    Cashfree is best positioned for marketplaces and vendor-heavy models. Its payout infrastructure and competitive transaction costs make it ideal where bulk disbursements are a core requirement.

    High Transaction Volume and Enterprise Scale

    PayU is the more appropriate choice for enterprises processing high volumes. Its negotiated pricing model and dedicated account support suit businesses with the scale to justify custom terms.

    Complex or Multi-Factor Requirements

    Businesses with international payment needs or those balancing success rates and costs should evaluate all three providers directly. The right choice depends on your specific payment mix and operational requirements.

    Final Thoughts

    Selecting a payment gateway is a long-term decision that shapes how your business handles money. Razorpay, PayU, and Cashfree each excel in different areas. The businesses that get this right are those that take the time to compare details, verify actual terms with each provider, and avoid jumping at the first option. This extra effort builds payment infrastructure that will hold up well beyond 2026.

    FAQs

    1. Which is the best payment gateway for 2026?

    There is no single best gateway for every business. Razorpay suits SaaS and subscriptions, Cashfree is ideal for marketplaces and payout-heavy operations, and PayU works well for enterprises needing negotiated pricing and dedicated support.

    2. How do Razorpay, PayU, and Cashfree differ in fees?

    Razorpay publishes a standard domestic fee of 2% + GST. Cashfree lists 1.95% for eligible merchants. PayU generally offers negotiated pricing based on volume.

    3. Which gateway is best for startups and small businesses?

    Razorpay is popular for its developer-friendly APIs, subscription tools, and straightforward onboarding. Cashfree is another strong option for competitive pricing and payout capabilities.

    4. Do they support UPI payments?

    Yes. All three support UPI, cards, net banking, and wallets. Razorpay and Cashfree also offer UPI AutoPay for recurring payments.

    5. What should businesses compare besides transaction fees?

    Compare settlement speed, success rates, integrations, recurring billing, payout capabilities, security, customer support, and scalability. These factors often have a greater long-term impact than fees alone.

  • S&P 500 Heads for Weekly Gain as Meta Rallies on AI Cost Savings and Circle Soars on OCC Nod

    S&P 500 Heads for Weekly Gain as Meta Rallies on AI Cost Savings and Circle Soars on OCC Nod

    The U.S. stock market moved in a narrow range on Friday, with the S&P 500 holding near the flatline as Wall Street wrapped up a largely positive week. The benchmark index is on track for a weekly gain of nearly 1%, while the Nasdaq Composite is set to rise more than 1%. The Dow Jones Industrial Average lagged slightly, heading for a weekly loss of less than 1%.

    Investors weighed a sharp rally from the previous session, driven by cooling oil prices and a temporary easing of Middle East tensions. President Donald Trump said Iran had called to make a deal, and officials from Qatar and Pakistan are working to restart talks between Washington and Tehran. “The muted stock market reaction to the re-escalation of Iran tensions this week is prime evidence that the market is looking past geopolitical tensions,” said Clark Bellin, president and chief investment officer at Bellwether Wealth.

    Chip Stocks Weaken Ahead of SK Hynix NASDAQ Debut

    Chip stocks traded lower ahead of SK Hynix’s U.S. market debut on the Nasdaq. The South Korean memory-chip maker priced its American depositary receipts at $149 each, raising $26.5 billion. The listing underscores strong investor demand for a major supplier in the AI chip supply chain. Micron Technology fell around 3%, while Marvell Technology and Lam Research lost more than 1%. Intel dropped nearly 3%, and Broadcom also traded lower. The iShares Semiconductor ETF declined 1.2%, and the VanEck Semiconductor ETF lost 0.8%.

    Meta Rallies on AI Cost Report

    Meta Platforms stood out among large technology stocks, rising nearly 6% on Friday and extending its five-session advance to more than 14%. The move placed Meta on track for its strongest weekly gain since February 2024. Bank of America maintained its buy rating after reviewing details tied to Meta’s AI infrastructure plans. According to Reuters, Meta plans to begin production of an in-house AI chip in September as part of a broader plan to double computing capacity. “Meta may have engineered significant cost savings to get capacity cost per MW well below our and Street expectations,” Bank of America analyst Justin Post wrote.

    Circle Shares Jump After OCC Approval

    Circle Internet Group shares surged more than 12% after the stablecoin issuer received final approval from the U.S. Office of the Comptroller of the Currency to establish a national trust bank. The approval moves Circle further into the regulated U.S. banking system, supporting its USDC infrastructure and adding federally regulated custody. Reserve management is planned as a future capability.

    Economy and Stocks Move at Different Speeds

    The stock market’s performance continues to diverge from the broader economy. The S&P 500 rose nearly 10% in the first half of 2026, while the Dow gained almost 9% over the same period. Meanwhile, economists say U.S. growth has slowed. “I think there’s this widespread perception the two should be in sync,” said Joe Seydl, senior markets economist at J.P. Morgan Private Bank. “But, from a purely analytical perspective, they’re two very different phenomena.” Mark Zandi, chief economist at Moody’s, added, “We’re growing. We’re not in recession. But we’re not going anywhere quickly.”

    For Friday’s session, investors focused on weekly gains, chip stock weakness, Meta’s rally, Circle’s bank approval, and the first trading day for SK Hynix in the United States.

  • Swiggy Shares Slip to Rs 273.29 as Foreign Ownership Dips Below 50%, Analysts Eye Long-Term Gains

    Swiggy Shares Slip to Rs 273.29 as Foreign Ownership Dips Below 50%, Analysts Eye Long-Term Gains

    Swiggy shares ended Friday at Rs 273.29 on the NSE, down 2.73% from the prior close, as profit-taking followed a recent rally. Despite the dip, the stock remains in focus after the company disclosed that foreign shareholding fell below the critical 50% threshold, a shift analysts believe strengthens its long-term prospects.

    Key Ownership Milestone

    Swiggy informed stock exchanges that total foreign shareholding has dropped to 49.76%, with domestic holdings rising to 50.24%. Crossing this mark makes Swiggy eligible for Indian-Owned and Controlled Company (IOCC) status under FEMA guidelines. While the change does not immediately affect operations, it grants greater regulatory flexibility, especially in sectors with foreign investment caps.

    Market Response and Profit Booking

    The ownership news initially sparked aggressive buying earlier in the week, pushing the stock into bullish technical territory with high volumes. However, Friday’s decline suggests traders are locking in gains after the sharp run-up. Analysts view this as a normal correction following news-driven moves.

    Technical Indicators Improve

    From a chart perspective, Swiggy is showing signs of base formation after months of weakness. Sustained buying will be needed to confirm a stronger upward trend, but momentum indicators are improving.

    Quick Commerce Remains Key Growth Driver

    Beyond ownership changes, Swiggy’s long-term appeal hinges on its expanding quick-commerce ecosystem. The company continues to invest heavily in Instamart, dark stores, and logistics to compete with Blinkit and Zepto. India’s online grocery and food delivery market is growing in both user base and order value.

    Risks to Watch

    Swiggy operates in one of India’s most competitive internet markets. Key risks include:

    • Ongoing pricing pressure from rivals
    • High capital expenditure on dark stores
    • Lagging profitability due to aggressive growth
    • Elevated market expectations after the recent bounce
    • Potential impact on consumer discretionary spending

    Outlook

    Swiggy’s shift to majority Indian ownership gives it strategic freedom and strengthens its position in the digital commerce landscape. While Friday’s fall reflects profit-taking, the broader narrative remains intact. If the company balances growth with improving profitability, it could emerge as a compelling long-term bet in India’s consumer tech space. Analysts will closely watch upcoming quarterly results and quick-commerce execution.

  • FTSE 100 Climbs 30 Points on US-Iran Diplomatic Hopes and Falling Oil Prices; Vodafone Surges 10.32%

    FTSE 100 Climbs 30 Points on US-Iran Diplomatic Hopes and Falling Oil Prices; Vodafone Surges 10.32%

    The FTSE 100 opened 30 points higher at 10,503 on Friday, buoyed by growing diplomatic optimism between the US and Iran that eased investor concerns over the Middle East conflict. The positive sentiment was further supported by a decline in oil prices, with Brent crude futures falling 0.83% to $75.71 a barrel and US West Texas Intermediate (WTI) dropping 0.74% to $71.55 a barrel.

    Sterling strengthened against both the dollar and the euro, trading at $1.3424 early Friday compared to $1.3397 at the London equities close on Thursday, and rising to €1.1736 from €1.1717 a day earlier.

    Gainers & Losers

    Top Gainers: Vodafone Group led the rally, soaring 10.32% to £107.85, after UAE telecom operator e& Group agreed to sell its entire 16.3% stake in Vodafone for $5.95 billion to an investment vehicle controlled by Xavier Niel’s family at a 13% premium to Vodafone’s last close. BT Group advanced 1.60% to £190, International Consolidated Airlines Group gained 1.52% to £473.40, Rio Tinto moved higher by 1.35% to £6,765, Airtel Africa added 1.31% to £325.80, and British Land climbed 1.29% to £424.60.

    Top Losers: On the downside, AstraZeneca declined 1.29% to £13,182, St. James’s Place slipped 6.81% to £1,177.50, Next fell 0.38% to £14,480, Admiral Group moved lower by 1.09% to £3,634, Coca-Cola HBC dropped 0.70% to £4,858, and Lion Finance Group eased 0.26% to £11,510.

    Political Developments

    In political news, Andy Burnham moved closer to becoming Prime Minister after hundreds of Labour MPs formally nominated him to succeed Keir Starmer as party leader. Burnham appeared on course to become Labour leader unopposed after the party said 322 of its 403 MPs backed his candidacy on the first day of nominations. The process closes on July 16, with Burnham set to be confirmed as Labour leader the following day if no challenger emerges.

    Mergers & Acquisitions

    Apollo has agreed to buy EasyJet in a deal valued at £5.7 billion, usurping an earlier bid from asset manager Castlelake. EasyJet said it had accepted an all-cash offer from the US investment giant valuing the airline at £714 a share, an 80% premium on the airline’s closing share price. The carrier stated that Apollo’s bid “delivers a superior outcome for EasyJet shareholders.”

    Corporate News

    Vodafone shares jumped after e& Group agreed to sell its entire 16.3% stake in Vodafone for $5.95 billion to Vega, an investment vehicle controlled by the family of French telecommunications entrepreneur Xavier Niel, at 112.5 pence per share—a 13% premium to Vodafone’s last close.

    Hays reported that it expects profit for the 2026 financial year to come in at the higher end of market estimates after cost cuts offset another quarter of weak recruitment activity. The recruiter said like-for-like net fees fell 5% in the three months to June 30, with temporary and contracting fees falling 3% and permanent fees dropping 7% as hiring declined through the quarter.

    Global Market View

    In the US, the tech-heavy Nasdaq climbed 1.3%, the S&P 500 added 0.8%, and the Dow Jones inched up 0.3%. In Asia, Tokyo’s Nikkei 225 rose 1.2% to 68,557.73, while China’s Shanghai Composite fell 1%. Hong Kong’s Hang Seng climbed 0.65%, and Australia’s S&P/ASX 200 rose 0.5%. In India, Nifty 50 and Sensex declined by 0.92% and 0.98%, respectively.

    Disclaimer: This article is provided for informational purposes only and does not constitute investment advice. You are responsible for conducting your own research before making any investments.