Blog

  • Bitcoin Dips to $62,702, Solana Slides Amid Iran Tensions and Senate Stalemate on Clarity Act

    Bitcoin Dips to $62,702, Solana Slides Amid Iran Tensions and Senate Stalemate on Clarity Act

    Bitcoin traded near $62,702 on July 13, down 1.99% in the past 24 hours, as renewed geopolitical tensions and a stalled U.S. crypto regulation bill weighed on market sentiment. Solana slipped 0.83% but held a weekly gain above 5%, while Ethereum stayed near $1,782, supported by steady ETF demand.

    The pullback follows a period of cautious trading after last week’s rally cooled. Key support for Bitcoin sits at $61,600, with resistance between $64,000 and $64,600. Analysts note that while institutional interest is showing early signs of recovery through spot Bitcoin ETF inflows, the broader market remains risk-off due to Middle East tensions and the Clarity Act’s uncertain path in the Senate.

    Bitcoin Price Today
    Bitcoin trades near $62,702.00, down 1.99% over the past 24 hours, according to CoinMarketCap data. Despite the dip, the asset retains a modest 0.72% weekly gain. Renewed U.S.-Iran friction and elevated oil prices continue to pressure risk assets, with traders eyeing the $61,600 support level.

    Expert Commentary
    Akshat Siddhant, Lead Quant Analyst at Mudrex, said: “Bitcoin remains resilient near key support even as geopolitical tensions stay elevated. Spot Bitcoin ETFs have posted renewed net inflows after a prolonged stretch of outflows. Investors are watching upcoming inflation data closely. A softer print could help Bitcoin retest resistance near $64,600, while renewed selling could expose support closer to $60,000.”

    The CoinSwitch Markets Desk added: “BTC has held its ground despite fresh geopolitical shocks tied to the collapsed Iran ceasefire. Spot Bitcoin ETF flows have turned positive after weeks of steady redemptions. This shift signals early-stage institutional recovery rather than a confirmed trend.”

    Riya Sehgal, Research Analyst at Delta Exchange, noted: “Global markets remain in a risk-off posture tied to renewed Middle East tensions and firmer bond yields. Bitcoin faces resistance near $63,800 to $64,000. Downside support sits closer to $62,000. Ethereum needs to hold its current structure to avoid a deeper correction.”

    Nischal Shetty, founder of WazirX, said: “Bitcoin is trading between key moving averages, and buyers still hold a modest near-term edge. A failure to reclaim recent highs could keep price action range-bound through the week. Ethereum has held firm near $1,780, supported by steady spot ETF demand.”

    Top 10 Coins at a Glance
    Biggest Decliners: HYPE (-2.82%), BTC (-1.99%), XRP (-1.94%). Most Resilient: USDC, USDT (near flat), TRX (-0.18%).

    Market Drivers
    Clarity Act Stalls: Galaxy Research cut passage odds to ~50%, with the bill stuck in Senate reconciliation. Failure before the August recess could push crypto regulation into election-year gridlock.

    Iran Tensions: Renewed hostilities after a ceasefire collapse keep risk sentiment subdued, with elevated oil prices and Strait of Hormuz concerns persisting.

    Tether Expansion: Tether invested $20 million into Mercado Bitcoin to expand Latin American payment infrastructure, signaling a shift toward regions with lighter compliance burdens.

    DOJ Operation Riptide: The Justice Department dismantled a major crypto laundering network linked to the Huione Group, seizing cloud servers tied to illicit transactions.

    Market Outlook
    Bitcoin holds near $62,700 as traders weigh geopolitical risk against steady ETF demand. A close above $64,000 could open a path to $65,500 resistance, while a slip below $61,600 risks exposing $60,000 support. Solana and XRP retain healthy weekly gains despite the pullback. The Fear and Greed Index near 31 reflects cautious sentiment. Key catalysts include the Clarity Act’s Senate progress, upcoming inflation data, and continued ETF flow trends.


  • How Artificial Intelligence Is Transforming Online Search: 7 Key Trends

    How Artificial Intelligence Is Transforming Online Search: 7 Key Trends

    Artificial intelligence is fundamentally reshaping how people find information online. Instead of typing short keywords, users now engage in natural conversations, search with images, and receive personalized, AI-generated answers. Here are seven major ways AI is changing online search.

    1. Conversational Search

    Users now ask complete questions instead of typing fragmented keywords. AI-powered search engines understand context, deliver direct answers, and engage in follow-up conversations. This reduces the need to open multiple websites, making information discovery faster and more natural for everyday users.

    2. Personalized Results

    AI analyzes search history, preferences, location, and behavior to deliver more relevant results. This personalization improves user experience by surfacing content that matches individual interests, helping people find useful information, products, or services with greater speed and accuracy than traditional search methods.

    3. Visual Search

    Users can now search using images instead of text. AI recognizes objects, products, landmarks, and even plants through computer vision, allowing shoppers, travelers, and students to instantly identify and learn about what they see using smartphones or other connected devices.

    4. Voice Search Growth

    AI-powered voice assistants have made spoken searches increasingly common. People can ask questions naturally while driving, cooking, or multitasking, with AI interpreting intent, understanding accents, and delivering accurate responses that feel more like conversations than traditional keyword-based searches.

    5. Generative AI Answers

    Search platforms increasingly generate summaries instead of simply listing links. AI combines information from multiple sources into concise responses, helping users understand topics quickly while changing how publishers, businesses, and content creators approach search engine optimization and online visibility.

    6. Smarter Shopping Searches

    AI simplifies online shopping by comparing products, summarizing reviews, recommending alternatives, and answering detailed buying questions. Consumers spend less time researching and more time making informed purchasing decisions based on personalized recommendations and real-time product information.

    7. Search Beyond Text

    AI is expanding search across videos, audio, documents, and multimedia content. Advanced models understand context within different formats, enabling users to find precise moments in videos, relevant podcast discussions, or specific document sections without manually browsing extensive content.

  • TCS and ABB Expand Partnership with AI-Driven Multi-Year Network Operations Deal

    TCS and ABB Expand Partnership with AI-Driven Multi-Year Network Operations Deal

    Tata Consultancy Services (TCS) and ABB have announced an expanded collaboration to transform ABB’s global network operations using AI. The multi-million, multi-year agreement marks the next phase of a 20-year partnership and will see TCS take on end-to-end network operations through an integrated network-as-a-service model.

    Under the deal, TCS will design, integrate, and run ABB’s global network ecosystem as a secure, modern, and AI-driven service. The core initiative is ABB’s Future Network Model programme, an enterprise-wide effort to replace fragmented network environments with a standardized, centrally managed digital infrastructure. TCS will orchestrate ABB’s multi-vendor environment and deploy a centralized control framework that includes service integration and management (SIAM), a global network operations center, advanced security capabilities, and modernized LAN, WAN, and software-defined WAN systems.

    “The Future Network Model represents an important milestone in reinforcing the digital foundation of ABB’s global operations,” said Alec Joannou, Group CIO at ABB. “Our association with TCS reflects a shared focus on delivery excellence, continuous enhancement, and building capabilities that can support our strategic priorities.”

    Anupam Singhal, President of Manufacturing at TCS, added: “With AI embedded into the network operations model, supported by secure digital infrastructure and our deep domain expertise, we are bringing our ‘infrastructure to intelligence’ approach to build a resilient, intelligent network backbone. This engagement will enable network systems that can sense, adapt, and improve continuously.”

    The expanded collaboration builds on two decades of joint transformational programmes, including consolidating multiple ERP systems into a unified SAP platform and accelerating cloud adoption. TCS expects the deal to improve user experience, enhance operational efficiency, strengthen security and compliance, and scale service delivery for ABB.

  • Free Fire MAX Redeem Codes for July 13, 2026: Grab Exclusive Emotes, Skins, Diamonds & More

    Free Fire MAX Redeem Codes for July 13, 2026: Grab Exclusive Emotes, Skins, Diamonds & More

    Garena has released the latest batch of Free Fire MAX redeem codes for July 13, 2026. These codes offer players a chance to unlock free Diamonds, weapon skins, outfits, emotes, and other cosmetic rewards. Since most codes are time-limited, early redemption is essential to secure the items.

    Active Free Fire MAX Redeem Codes for July 13, 2026

    Below is the list of valid codes for today. Redeem them as soon as possible to avoid missing out.

    • FFR4G3HM5YJN
    • 6KWMFJVMQQYG
    • FZ5X1C7V9B2N
    • FT4E9Y5U1I3O
    • FP9O1I5U3Y2T
    • FM6N1B8V3C4X
    • BR43FMAPYEZZ
    • UPQ7X5NMJ64V
    • FU1I5O3P7A9S
    • F7F9A3B2K6G8
    • FE2R8T6Y4U1I
    • S9QK2L6VP3MR
    • FA3S7D5F1G9H
    • FK3J9H5G1F7D

    Note: These codes may expire after 18 hours. Redeem them promptly.

    How to Redeem Free Fire MAX Codes

    Follow these simple steps to claim your rewards:

    1. Visit the official Free Fire Rewards Redemption website.
    2. Log in using your Gmail, Facebook, Twitter (X), or VK ID.
    3. Copy and paste the code into the designated field.
    4. Click ‘Confirm’ and then ‘OK’ to verify your redemption.
    5. Wait up to 24 hours for the rewards to appear in your in-game mailbox. Diamonds and other currencies update instantly.

    Important Reminders for Code Redemption

    Keep these points in mind to ensure successful redemptions:

    • Codes are time-sensitive — most expire within 18 hours.
    • Some codes have limited availability (e.g., first 1,000 players).
    • Each code can be used only once per account. Guest accounts are not eligible.
    • Enter codes exactly as shown; incorrect input yields no rewards.
    • Certain codes are region-specific and may not work outside designated servers.

    Final Thoughts

    Free Fire MAX redeem codes are more than just giveaways — they are effective engagement tools that keep players returning daily. The limited-time cosmetic rewards create urgency and reward loyalty without affecting gameplay balance. For players, speed and accuracy are key to maximizing benefits. Missing a code window means losing both free items and customization opportunities.

  • Indian Stock Market Slides as Rising Oil Prices Weigh on Sentiment; Nifty50 Hits 24,124, Sensex at 77,279

    Indian Stock Market Slides as Rising Oil Prices Weigh on Sentiment; Nifty50 Hits 24,124, Sensex at 77,279

    The Indian stock market experienced a cautious trading session on July 13, with both benchmark indices declining as escalating US-Iran tensions pushed crude oil prices higher. The Nifty50 slipped 8.95 points (0.34%) to 24,124.95, while the Sensex dropped 290 points (0.37%) to 77,279.48. Investor sentiment turned risk-averse, with selling pressure spanning multiple sectors.

    Key Takeaways

    • Nifty50 and Sensex trade lower as crude oil prices rise on renewed US-Iran tension.
    • Metal, financial, auto, and banking stocks underperform, while IT and pharma show relative strength.
    • Laser Power & Infra, Devson Catalyst, and Happy Steels IPOs enter their final day of subscription.

    Rising Oil Prices Weigh on Market Mood

    The latest surge in crude oil prices stems from renewed geopolitical tension between the United States and Iran, raising fears of potential supply disruptions. As India is a major importer of crude oil, higher prices typically increase transportation, manufacturing, and production costs, fueling inflationary pressures and potentially squeezing corporate earnings. This has prompted investors to reduce exposure to sectors sensitive to rising operational expenses.

    Heavyweight Stocks Drag Indices Lower

    Major stocks such as InterGlobe Aviation, Tata Steel, and Maruti Suzuki India were the top losers in the Nifty50. InterGlobe Aviation faced headwinds from higher fuel costs, while Tata Steel suffered from broad selling in the metal sector. Maruti Suzuki India declined amid concerns over rising input costs affecting the automobile industry.

    Broader Market Also Under Pressure

    The weakness extended beyond large-cap stocks. The Nifty MidCap fell 0.29%, and the Nifty SmallCap slipped 0.13%, indicating that selling pressure was widespread across market segments.

    Sectoral Performance: Metal Stocks Hit Hardest

    The Nifty Metal index posted the worst performance, driven by global economic uncertainties. Nifty Financial Services and Nifty Auto also remained under strain, with the latter particularly impacted by rising crude prices affecting production costs and consumer demand. The Nifty Bank index faced similar selling pressure.

    In contrast, Nifty IT and Nifty Pharma outperformed. Investors typically pivot to defensive sectors like IT and pharma during periods of uncertainty, as their earnings are less sensitive to commodity price fluctuations.

    IPO Market Remains Active

    Despite the volatile market, the primary market is buzzing. The Laser Power & Infra IPO, aiming to raise Rs. 742 crore, enters its final subscription day. Devson Catalyst (Rs. 42.32 crore) and Happy Steels (Rs. 25 crore) IPOs also conclude their subscription period today, attracting investor interest.

    Market Outlook

    The Indian stock market is trading with a negative bias, driven by escalating US-Iran tensions and higher crude oil prices. Weakness in metal, financial, auto, and banking sectors adds to the pressure, while IT and pharma provide limited support. The broader market reflects cautious sentiment. The next direction will depend on global developments, crude oil price movements, and investor confidence.

    Frequently Asked Questions

    1. Why are crude oil prices dragging down the Indian stock market?

    India is a major oil importer. Rising crude prices increase operational costs for businesses—particularly in aviation, logistics, and manufacturing—while fueling inflationary concerns that can squeeze corporate profit margins.

    2. Which sectors are being hit hardest today?

    The Nifty Metal index is seeing the sharpest declines amid global economic jitters. The Auto, Financial Services, and Banking sectors are also under significant selling pressure.

    3. Why are IT and Pharma stocks performing relatively better?

    Investors often pivot to IT and Pharma during periods of geopolitical uncertainty. These sectors are considered ‘defensive’ since their earnings are typically less sensitive to fluctuating commodity and energy prices.

    4. What is the current status of the IPO market?

    Despite broader market volatility, the primary market remains active. The Laser Power & Infra, Devson Catalyst, and Happy Steels IPOs are all in their final day of subscription, drawing continued investor interest.

    5. How should investors navigate this period of uncertainty?

    Market participants are currently practicing caution by avoiding aggressive bets. Most are closely monitoring US-Iran developments, as any further escalation in crude prices will likely dictate whether the market finds stability or faces further downside.

  • Zelio E-Mobility Opens New Coimbatore Plant to Boost South India EV Manufacturing

    Zelio E-Mobility Opens New Coimbatore Plant to Boost South India EV Manufacturing

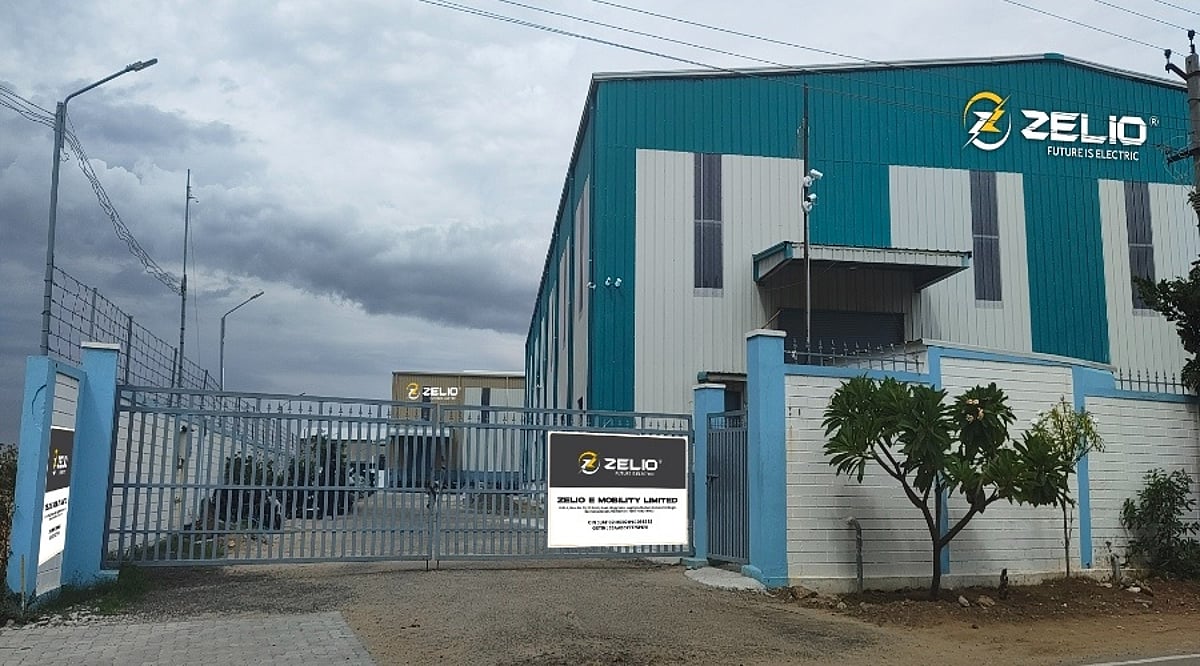
    Zelio E-Mobility, a rapidly growing electric two- and three-wheeler manufacturer, has announced the opening of a new manufacturing facility in Coimbatore, Tamil Nadu, to strengthen its presence in South India. The move supports the company’s strategy to expand across key southern markets including Tamil Nadu, Karnataka, Kerala, Telangana, Andhra Pradesh, and South Maharashtra.

    The new facility, located on Trichy Road in Nagiyyaan Thottam, Lakshmi Nagar Kannampalayam, spans approximately 39,000 square feet. It will handle electric scooter assembly, storage, logistics, and allied operations. The plant has an installed production capacity of 60,000 units per year, initially targeting 24,000 to 30,000 electric two-wheelers annually, with plans to scale production based on demand.

    This expansion adds to Zelio E-Mobility’s existing manufacturing network, which includes plants in Ladwa (Haryana), Patan (Haryana), and Cuttack (Odisha). With the new facility, the company’s total installed manufacturing capacity increases by 33% to 240,000 units per year, up from 180,000 units previously.

    The Coimbatore plant currently employs 30 direct workers and is expected to contribute to the company’s goal of surpassing 500 employees this fiscal year, adding over 100 personnel in the coming months. Established with a capital investment of up to INR 1 crore, the facility will produce models from Zelio E-Mobility’s product portfolio, with specific model details to be announced later.

    Kunal Arya, Managing Director of Zelio E-Mobility, said: “The launch of our Coimbatore facility marks a major milestone in Zelio E-Mobility’s growth journey. South India represents one of the most promising electric mobility markets in the country, and this expansion strengthens our ability to serve customers, dealers, and partners with greater speed and efficiency.”

    The plant follows the same manufacturing standards and quality protocols as the company’s existing facilities. Future technology upgrades and sustainability initiatives will be announced in due course.

    Zelio E-Mobility has reported strong financial growth, with revenue rising 81.8% year-on-year to INR 313.68 crore in FY2025–26 and a four-year revenue CAGR of 121%. The company has remained profitable since inception and, following its BSE SME listing in October 2025 (where it raised INR 78.34 crore), continues to expand its dealer network, which now exceeds 400 dealerships across 25+ states, with plans to reach 550+ by FY27.

  • Crypto Phishing Scams: How to Spot Fake Apps, Websites, and Address Poisoning

    Crypto Phishing Scams: How to Spot Fake Apps, Websites, and Address Poisoning

    Crypto phishing scams have become one of the biggest threats to digital asset users. With more investors using wallets, exchanges, DeFi platforms, and NFT marketplaces, scammers are increasingly deploying fake websites, wallet-draining links, and AI-generated messages to raid crypto wallets.

    According to the FBI’s latest internet crime data reported by The Wall Street Journal, cryptocurrency crime is now the most costly type of internet crime, totaling $7.2 billion. The report also noted a rise in AI-powered scams, with over 22,000 complaints and losses of nearly $893 million.

    What is a Crypto Phishing Attack?

    A crypto phishing scam is a fraud attempt designed to steal wallet credentials, seed phrases, exchange passwords, or transaction approvals. Unlike traditional bank fraud, scammers don’t always need your login information. In some cases, all they need is for you to sign a malicious wallet transaction.

    These scams often appear as fake airdrops, token claim pages, NFT mint links, customer support messages, or urgent wallet verification requests. Once a user connects their wallet and confirms the request, the attacker can drain the tokens.

    How to Identify Fake Crypto Websites

    Fake crypto sites typically copy the design of popular exchanges, wallets, or DeFi platforms. The domain may look similar but with slight differences: misspellings, extra hyphens, strange extensions, or fake login pages.

    Watch for warning phrases like:

    • “Verify Your Wallet Now”
    • “Claim Reward Before Expiry”
    • “Urgent Account Suspension”
    • “Connect Wallet to Unlock Funds”

    A legitimate exchange will never ask for your seed phrase. Always type the official URL directly or use a bookmark. Avoid clicking links from Telegram, Discord, X, WhatsApp groups, or sponsored search results without verification.

    How to Identify Fake Crypto Apps

    Research on cryptocurrency exchange scams uncovered over 1,500 fraudulent domains and more than 300 fake apps, some of which made it to major app marketplaces. Before downloading, verify the app’s history, reviews, and developer name. Check how long it has been available, the official website link, and the app’s reputation. Never download APKs from unknown sources.

    During setup, a fake app may request your recovery phrase under the guise of security verification or customer support. That’s a major red flag.

    Watch Out for Address Poisoning

    Address poisoning is a phishing attack where scammers send small transactions from lookalike wallet addresses. The goal is to trick users into copying the wrong address from their transaction history. A 2025 study found approximately 270 million on-chain address poisoning attempts targeting 17 million victims, resulting in at least $83.8 million in losses.

    Why This Matters

    The escalation of AI-driven phishing and address poisoning matters because scammers no longer need to hack blockchains. By weaponizing urgency and lookalike addresses, they trick users into authorizing irreversible transactions that drain wallets instantly — turning user error into crypto’s costliest threat.

    Final Thoughts

    • Never share your seed phrase.
    • Only download apps from official sources.
    • Store larger amounts on a hardware wallet.
    • Check URLs carefully.
    • Revoke suspicious wallet approvals.
    • Test large transfers with a small amount first.

    Remember the three elements of crypto scams: urgency, fear, and greed. If a message feels urgent, secret, or too good to be true, pause, verify, and proceed only if you’re certain.

    Frequently Asked Questions

    1. What is a crypto phishing scam?

    A crypto phishing scam is a fraud attempt designed to steal wallet credentials, seed phrases, exchange passwords, or transaction approvals. Scammers often use fake websites, airdrops, NFT mint links, or support messages to trick users.

    2. How can I identify a fake crypto website?

    Fake crypto websites often copy real platforms but use slightly changed domains, misspellings, extra hyphens, or unusual extensions. Any site asking for a seed phrase or urgent wallet verification should be treated as suspicious.

    3. Are fake crypto apps dangerous?

    Yes, fake crypto apps can steal recovery phrases, login details, or wallet permissions. Always check the developer name, app history, reviews, and official website before downloading any crypto wallet or exchange app.

    4. What is address poisoning in crypto?

    Address poisoning is a scam where attackers send small transactions from lookalike wallet addresses. The goal is to make users accidentally copy the wrong address from their transaction history and send funds to the scammer.

    5. How can crypto users stay safe from phishing scams?

    Users should never share seed phrases, avoid unknown links, use official app stores, bookmark trusted websites, and test large transfers with small amounts first. Hardware wallets can also improve security for larger holdings.

  • Kalyan Jewellers Surges 47% in Four Days – Should Investors Buy, Sell, or Hold?

    Kalyan Jewellers Surges 47% in Four Days – Should Investors Buy, Sell, or Hold?

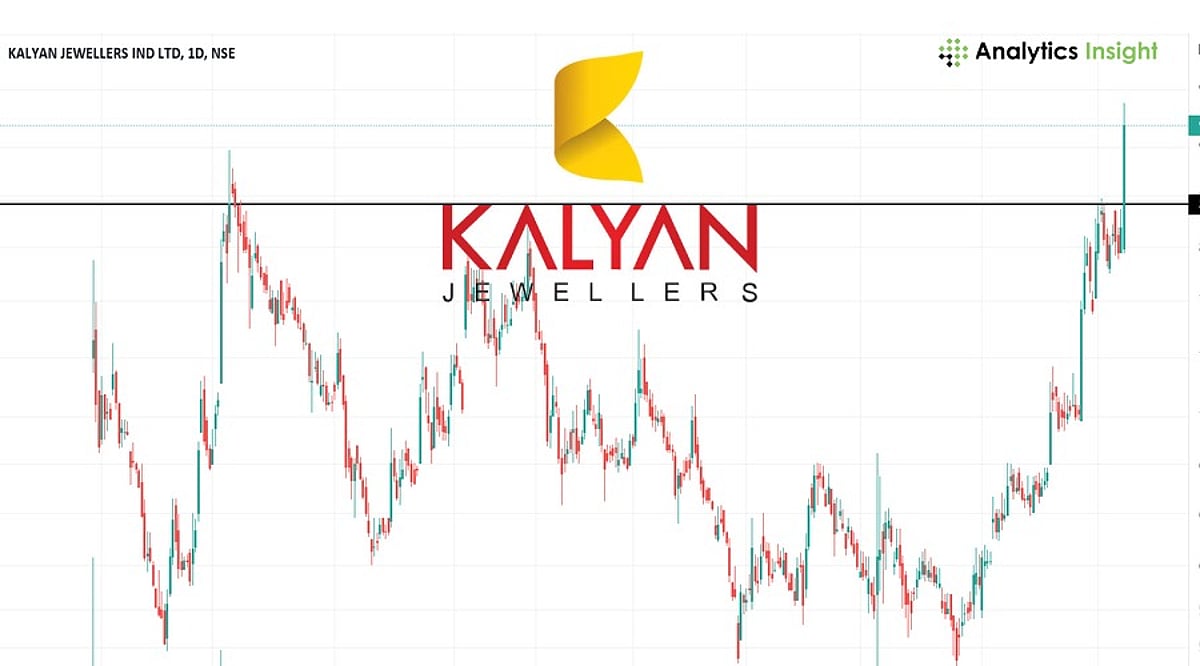
    Kalyan Jewellers closed at Rs. 524.75 on the NSE on Monday, capping a stunning four-day rally of nearly 47%. The stock touched an intraday high of Rs. 527.60, adding roughly Rs. 16,500 crore to the company’s market capitalization. The surge has made it one of the strongest performers on Dalal Street this week.

    Driven by a better-than-expected quarterly business update, robust domestic demand, and aggressive showroom expansion, investor confidence surged across the organized jewelry sector. The stock also broke above key resistance levels, attracting momentum traders and triggering short covering.

    While the rally reflects strong fundamentals, the rapid price appreciation now raises a critical question: should investors chase the stock or book profits?

    What’s Fueling the Rally?

    Several catalysts converged to propel shares higher:

    • Strong Q1 performance: Kalyan Jewellers reported impressive revenue growth despite elevated gold prices, indicating resilient demand for branded jewelry.
    • Expansion strategy: The company continues to open new showrooms, especially in high-growth regions, leveraging a franchise model to scale quickly.
    • Sector tailwinds: India’s organized jewelry market benefits from shifting consumer preferences toward hallmark jewelry, transparent pricing, and trusted brands.
    • Wedding and premiumization demand: Secular trends like wedding spending and premiumization provide a long-term growth runway.

    These structural factors go beyond short-term trading momentum, creating a compelling investment thesis.

    Valuation Concerns Emerge

    Despite the positive outlook, a 47% rise in just four sessions significantly alters the risk-reward equation. The stock now prices in not only a strong first quarter but also sustained earnings growth over several quarters. Expectations have risen sharply.

    To justify the current valuation, Kalyan Jewellers must consistently deliver revenue growth, maintain healthy margins despite gold price volatility, and execute its expansion plans effectively. Any slowdown in execution could trigger a correction.

    Should Investors Book Profits?

    The answer depends on your investment horizon:

    • Short-term traders: Booking partial profits after a near 50% run-up is logical, as sharp moves often lead to consolidation.
    • Long-term investors: Those focused on the structural growth story of India’s organized jewelry market may prefer to hold, given Kalyan Jewellers’ strong positioning. Portfolio rebalancing, rather than a full exit, can be a prudent approach.

    Peer Performance

    The rally also lifted sentiment for other listed jewelry stocks. Titan, Senco Gold, P N Gadgil Jewellers, and Thangamayil Jewellery have all gained on improved sector confidence and strong business updates.

    Market Outlook

    The recent surge reflects more than a short-term reaction – it signals growing confidence in organized jewelers that are capitalizing on formalization of the Indian jewelry market. However, given the sharp rally, the stock’s next leg will depend on the company’s ability to convert demand into earnings growth, sustain margins, and execute expansion successfully.

    FAQs

    1. Why did Kalyan Jewellers’ shares rally nearly 47%?

    The rally followed a strong Q1 business update, robust domestic demand, store expansion plans, and increased investor confidence in organized jewelry retailers.

    2. Should investors book profits after the rally?

    Short-term traders may consider partial profit booking, while long-term investors should focus on earnings growth, expansion strategy, and future business performance.

    3. How did Kalyan Jewellers perform on Monday?

    The stock rose 10.21% to close at Rs. 524.75 on the NSE, with an intraday high of Rs. 527.60.

    4. Which other jewellery stocks are gaining?

    Titan, Senco Gold, P N Gadgil Jewellers, and Thangamayil Jewellery have also gained on improving sector sentiment.

    5. What will determine Kalyan Jewellers’ future stock performance?

    Consistent revenue growth, healthy margins, successful store expansion, festive demand, and sustained investor confidence.

    Disclaimer: This article is for informational purposes only and does not constitute investment advice. Always do your own research before investing.

  • Bitcoin Drops to $62,745 as Bears Maintain Control Below $64,000

    Bitcoin Drops to $62,745 as Bears Maintain Control Below $64,000

    Bitcoin faced heavy selling pressure on July 13, 2026, with prices slipping to around $62,745 as bears tightened their grip below the key $64,000 resistance level. The cryptocurrency experienced a sharp decline after failing to sustain a move above $64,000, reflecting weak institutional demand, cautious market sentiment, and fresh macroeconomic headwinds.

    Technical Chart Shows Strong Bearish Trend

    A 15-minute BTC/USD chart revealed a clear bearish setup throughout the session. Bitcoin traded near $64,200–$64,300 before sellers entered aggressively, driving the price below the short-term moving average and the lower Bollinger Band. The decline was accompanied by a significant increase in trading volume, confirming seller conviction. The market found temporary support near $62,700, but the overall trend remained negative as buyers failed to push the price back above key resistance levels.

    Bollinger Bands Point to More Volatility

    The Bollinger Bands reinforced the bearish outlook. Bitcoin remained below the middle Bollinger Band (near $63,000–$63,100), which has become the first major resistance area. The upper band is moving lower, indicating weakening bullish momentum, while the lower band continues to expand, signaling increased volatility. Unless Bitcoin climbs back above the middle Bollinger Band, sellers are likely to retain control in the short term.

    RSI Shows Weak Buying Strength

    The Relative Strength Index (RSI) remains weak, staying near 35 after a brief dip into oversold territory. This reading is well below the neutral level of 50, indicating limited buying interest. The small uptick in RSI does not confirm a trend reversal; a sustained move above 50 would be needed to improve the technical outlook.

    Volume Confirms Seller Control

    Trading volume surged during the breakdown below $64,000, confirming strong selling pressure. Subsequent buying activity near $62,700 was noticeably weaker, suggesting buyers are only defending support rather than initiating a new uptrend. As long as selling volume outpaces buying volume, the market may continue to face downward pressure.

    Important Price Levels to Watch

    • First resistance: $63,000–$63,100 (short-term moving average and intraday highs)
    • Major resistance: $63,800–$64,000 (former support turned resistance)
    • Immediate support: $62,500
    • Next support: $62,000
    • Critical support: $60,000 (psychological level)

    Macro Factors Continue to Affect Bitcoin

    Geopolitical tensions in the Middle East have boosted demand for the US dollar and pushed energy prices higher, raising inflation concerns and the possibility of tighter monetary policy. This has reduced risk appetite among investors, affecting cryptocurrencies. Institutional sentiment remains mixed amid recent Bitcoin ETF outflows and a disclosure that Strategy sold approximately $216 million worth of Bitcoin, adding to concerns about selling pressure. On a positive note, Bitcoin’s mining difficulty dropped about 5%, which may reduce forced selling from miners if network conditions stabilize.

    Outlook

    Bitcoin remains well below its all-time high of over $120,000 set in 2025. The market continues to form lower highs and lower lows, confirming a bearish trend. A meaningful recovery would require a break above the $63,800–$64,000 resistance zone with strong volume. Until then, sellers are expected to remain in control. Key support levels to monitor are $62,000 and $60,000.

    FAQs

    1. Why did Bitcoin fall on July 13, 2026?

    Bitcoin dropped due to strong selling pressure, weak institutional sentiment, and growing geopolitical and macroeconomic concerns.

    2. What is the nearest resistance level for Bitcoin?

    The first resistance lies between $63,000 and $63,100, followed by a stronger resistance zone between $63,800 and $64,000.

    3. Which support levels are important now?

    Immediate support is near $62,500, while $62,000 and $60,000 remain major levels to watch.

    4. What does the RSI indicate?

    The RSI stays around 35, indicating weak buying momentum and continued bearish market conditions.

    5. What could improve Bitcoin’s outlook?

    A strong move above $63,800–$64,000, supported by higher buying volume, would improve the short-term technical outlook.

  • FTSE 100 Opens Lower as Middle East Tensions Drive Brent Crude Up 3.72%

    FTSE 100 Opens Lower as Middle East Tensions Drive Brent Crude Up 3.72%

    The FTSE 100 opened 10 points lower at 10,486.74 on Monday, as renewed escalation in the Middle East pushed oil prices sharply higher. Energy-heavy blue-chip stocks helped offset a broader risk-off mood across the market.

    Brent crude futures surged 3.72% to $78.90 a barrel, while US West Texas Intermediate (WTI) advanced 3.74% to $74.08 a barrel. Sterling weakened to $1.3380, down from $1.3419 at the London close on Friday, and fell against the euro to €1.1730 from €1.1737.

    Gainers and Losers

    Top Gainers:

    • Persimmon: +3.52% to £1,073.50
    • Vodafone Group: +3.13% to £113.55
    • Shell: +1.38% to £3,080.50
    • BP: +2.59% to £495.15
    • Computacenter: +1.93% to £4,540
    • BT Group: +1.55% to £193

    Notable Losers:

    • AstraZeneca: -1.26% to £12,672
    • Spirax Group: -1.53% to £6,455
    • Endeavour Mining: -1.80% to £3,610
    • Diploma: -0.96% to £6,735
    • Halma: -1.70% to £3,578
    • Antofagasta: -1.43% to £3,724

    Corporate Updates

    ME Group Reaffirms Profit Guidance

    ME Group has expanded into user-operated dog washing machines to recover from the revenue hit caused by the Iran war. The firm installed 200 machines across the UK, France, and the Republic of Ireland, noting they are proving popular. Revenue slipped 1% to £152 million on a constant currency basis in the six months to end of April, while pre-tax profit fell 6% to £32 million.

    PageGroup Profit Declines 5.4%

    Recruiter PageGroup reported a 5.4% drop in second-quarter profit to £21.8 million, an improvement from the 11.4% decline in the prior quarter. Temporary recruitment rose 1%, outperforming permanent recruitment, which fell 8%. Group profit remained flat at £197.6 million, with about half of operating markets seeing growth, particularly southern Europe.

    Plus500 Half-Year Revenue Jumps 12%

    Plus500 reported its highest half-year revenue in three years at $462.9 million, up 12% year-over-year. Customer income rose 24% to a five-year record of $460.8 million. Underlying EBITDA edged up 1% to $187.5 million, though the margin slipped to 41% from 45% due to increased spending on customer acquisition and US investment.

    Global Market Overview

    US futures pointed lower, with the Nasdaq expected to fall 1.3%, while the Dow Jones and S&P 500 were seen dropping 0.35% and 0.55%, respectively. In Asia, Tokyo’s Nikkei 225 fell 1.92% to 67,242.73, China’s Shanghai Composite dropped 2.06%, and Hong Kong’s Hang Seng edged up 0.064%. Australia’s S&P/ASX 200 rose 0.03%. In India, the Nifty 50 and Sensex advanced 0.14% and 0.11%, respectively.