Tag: market analysis

  • Bitcoin Bounces Back Above $63,000 as Whale Buying Offsets Heavy ETF Outflows

    Bitcoin Bounces Back Above $63,000 as Whale Buying Offsets Heavy ETF Outflows

    The crypto market traded on a stronger footing today as Bitcoin climbed near $63,148, rising 0.70% on the day and 6.09% over the week. The rebound follows a harsh first half of 2026, during which Bitcoin slumped from above $93,000. Despite the recovery, the Bitcoin price is still down 27.84% year-to-date after closing June near $60,000.

    Bitcoin Regains Ground After June Sell-Off

    Bitcoin moved back above $63,000 after reversing late-June losses during thin July 4 trading. The move marked its highest level in more than a month, while XRP gained 5% in 24 hours to lead major tokens. Still, the broader picture reveals deep market damage. Bitcoin dropped to a fresh 21-month low in the final week of June before buyers returned in early July.

    Crypto prices today reflect two competing forces. ETF outflows continue to weigh on sentiment, yet large Bitcoin holders have stepped in with aggressive dip buying.

    ETF Outflows Clash with Whale Accumulation

    U.S. spot Bitcoin ETFs recorded their largest monthly outflow since inception in June, with roughly $4.51 billion leaving the products. BlackRock’s IBIT led the withdrawals, according to the figures provided in the report.

    The scale of these outflows prompted Citigroup to cut its one-year Bitcoin target from $112,000 to $82,000. That revision followed weaker demand from ETF-linked capital flows.

    At the same time, Bitcoin whales bought $16.7 billion worth of Bitcoin over two weeks. That buying came as ETFs bled about $4 billion, creating a clear split between institutional product flows and large-holder accumulation.

    Softer macro signals also supported the BTC rebound. Bitcoin climbed back above $61,000 after Federal Reserve Chair Kevin Warsh suggested inflation risks had eased, reducing fears of harsher policy.

    Bitcoin’s Role Moves Beyond Market Cycles

    Bitcoin’s next decade is expected to be shaped less by protocol changes and more by global financial adoption. This view positions Bitcoin as a monetary network rather than a technology stock, payment company, or software platform.

    Bitcoin’s core role centers on stable operation, scarce supply, and final settlement. Its value proposition rests on serving as neutral digital capital that supports credit and commercial activity.

    The base layer supports large-scale asset liquidation, corporate reserves, collateral settlement, and final ownership transfers. Meanwhile, payments, lending, credit products, banking services, and wealth tools can develop around Bitcoin-linked systems.

    The four-year halving cycle still matters, as each halving cuts new supply and protects Bitcoin’s 21 million supply rule. However, halving alone can no longer explain Bitcoin’s overall trend.

    Capital flows now hold greater influence over price movements. ETF flows, corporate treasury allocations, sovereign reserves, derivatives funds, insurance funds, collateral demand, credit structures, and global savings flows all shape demand.

    The next stage of Bitcoin adoption may come through balance sheets across industries. Bitcoin’s broader use will depend on deeper capital markets, wider applications, and rising institutional participation.

    What’s Next?

    Bitcoin regained strength above $63,000 as whale accumulation helped offset heavy crypto ETF outflows. Still, year-to-date losses show that pressure remains. The market’s next direction may depend on capital flows, institutional demand, and Bitcoin’s growing role in global financial systems.

  • Bitcoin Reclaims $63,251 as ETF Inflows Return and CLARITY Act Stalls – July 6 Market Update

    Bitcoin Reclaims $63,251 as ETF Inflows Return and CLARITY Act Stalls – July 6 Market Update

    Bitcoin is trading near $63,251.48, up 0.68% over 24 hours and 5.91% higher on the week, as spot ETF inflows return after a record outflow streak in June. The token has climbed above its late-June lows near $58,000, with a market cap of approximately $1.26 trillion and 24-hour volume near $19.28 billion.

    Hyperliquid and BNB lead today’s gainers, while the CLARITY Act misses its symbolic July 4 signing deadline in the Senate. The Fear and Greed Index sits at 28, still cautious but improving from June’s extreme fear reading of 18.

    Market Dynamics and Analyst Commentary

    Akshat Siddhant, Lead Quant Analyst at Mudrex, noted: “Bitcoin climbed sharply over the weekend as thin liquidity during the holiday period amplified buying activity. Sentiment improved after spot ETFs attracted $224 million in net inflows, ending a six-day outflow streak. Bitcoin’s realized profit-and-loss ratio dropped to its lowest level in 43 months, a metric that has historically marked major bottoms. Mondays have stayed weak recently, so a failure to hold $64,000 could send BTC back toward $60,500.”

    Riya Sehgal, Research Analyst at Delta Exchange, added: “Bitcoin’s rebound has been supported by short covering and a weaker dollar after oil prices eased. US spot Bitcoin ETFs saw $223.5 million in net inflows on July 2, reversing the prior day’s $296 million outflow. Ethereum ETFs logged a second straight positive day. BTC stays capped below its 200 EMA near $63,920, making $64,000 the key breakout level.”

    According to the CoinSwitch Markets Desk: “BTC is holding near its highest level in two weeks after a modest bounce, but it has struggled below this zone for weeks. The Fed releases its meeting notes soon, and a hawkish tone could pressure prices again. Wednesday’s Fed update remains the one to watch.”

    Top 10 Crypto Prices at a Glance (July 6)

    • Biggest Gainers: Hyperliquid (+3.71%), BNB (+2.25%)
    • Biggest Losers: Solana (+0.13%), XRP (+0.48%)

    Key Crypto News Driving Sentiment

    Spot Bitcoin ETFs Snap Outflow Streak

    Spot Bitcoin ETFs recorded $223.5 million in net inflows this week, reversing a prior single-day outflow of nearly $300 million. Spot Ethereum ETFs also logged a second straight day of positive flows, signaling improving institutional appetite after June’s record redemptions.

    CLARITY Act Misses July 4 Deadline

    The White House had targeted July 4 for signing the CLARITY Act into law. Senate cloture math remains short of the 60 votes needed, and prediction markets have trimmed 2026 passage odds. A House Financial Services Committee hearing is expected later this month.

    Satoshi’s Bitcoin Freeze Debate Resurfaces

    Binance founder Changpeng Zhao suggested Satoshi Nakamoto’s estimated 1.1 million BTC should be frozen before quantum computing advances threaten old wallets. The proposal has split the community, with critics calling it a violation of Bitcoin’s core neutrality principle.

    Aptos Blockchain Flaw Patched After Disclosure

    Security researchers identified a critical flaw in the Aptos blockchain that could have exposed roughly $70 billion in crypto assets. The bug has since been patched, and the disclosure has renewed attention on smart contract audits across major chains.

    Investor and Market Outlook

    Bitcoin enters the second week of July in a cautiously improving position. The Fear and Greed Index sits at 28, still guarded but well above June’s extreme fear reading of 18. ETF inflows are returning, though a sustained move above $64,000 remains the key confirmation traders want before calling a firm bottom.

    The macro calendar stays active this week, with Fed meeting notes due and the CLARITY Act’s Senate path still unresolved. Investors should track daily ETF flow data, Bitcoin’s ability to hold above $60,500, and any fresh signal on the July 29 FOMC decision. Avoiding excess leverage remains the practical priority until $64,000 is reclaimed with volume.

    Frequently Asked Questions

    What is the Bitcoin price today? Bitcoin is trading near $63,251.48 today, up 0.68% over the past 24 hours and 5.91% higher on the week. Support holds near $60,500, while resistance sits at $64,000.

    Why is Bitcoin recovering in July 2026? Spot Bitcoin ETFs snapped a six-day outflow streak after fresh inflows arrived this week, easing the selling pressure that pushed BTC to a 21-month low in June. Improving on-chain metrics have also supported the bounce.

    What is the biggest crypto news today? The CLARITY Act missing its symbolic July 4 signing deadline, returning spot ETF inflows across Bitcoin and Ethereum, and the resurfacing debate over freezing Satoshi Nakamoto’s dormant wallet are the top stories driving sentiment today.

    Which coins are gaining the most today? Hyperliquid leads the top ten with a 3.71% gain, supported by rising on-chain trading volume. BNB follows closely at 2.25%, while Solana and XRP trail the broader market with smaller single-day moves.

    What should crypto investors watch this week? Monitor daily spot ETF flow data closely, along with any signal from the Fed’s upcoming meeting notes. Bitcoin’s ability to hold above $60,500 and reclaim $64,000 with strong volume remains the key technical trigger heading into late July.

  • XRP Surpasses Bitcoin in Upbit Volume as $1.15 Becomes Next Target

    XRP Surpasses Bitcoin in Upbit Volume as $1.15 Becomes Next Target

    XRP has overtaken Bitcoin in 24-hour trading volume on Upbit, South Korea’s largest digital asset exchange, as the token holds above the reclaimed $1.10 level. The surge in activity places XRP among the busiest assets on the platform and shifts market focus toward the $1.15 resistance level.

    XRP Overtakes Bitcoin in Upbit Trading

    Over the past 24 hours, XRP recorded approximately 113.18 million XRP in trading volume on Upbit, surpassing Bitcoin during that period. South Korea has historically been a major hub for XRP trading, and sharp increases in activity on Korean exchanges often attract broader market attention.

    Rising volume alongside price typically signals wider market participation, suggesting that more buyers have entered the market rather than a narrow group of traders driving the move. However, volume alone does not guarantee sustained gains — price direction depends on whether buyers can maintain support and absorb renewed selling pressure.

    Break Above $1.10 Changes the Technical Setup

    XRP recently reclaimed the $1.10 level after struggling for weeks to break above it. Previous recovery attempts repeatedly stalled at that zone, making the latest breakout more significant for traders. Buyers have so far defended support above the former resistance, helping XRP form a sequence of higher highs and higher lows — a pattern often associated with strengthening bullish momentum.

    Still, the structure remains incomplete without sustained buying above the breakout zone. A quick drop below $1.10 could weaken the setup and return XRP to sideways trading. Conversely, continued support would keep the $1.15 level as the next critical test for buyers.

    Low Average Returns Fuel Relief Rally Expectations

    A recent Santiment Data post highlighted historically low average returns on the XRP Ledger, which analysts have linked to the potential for a relief rally. This development coincides with signs of altcoin rotation in the broader cryptocurrency market. XRP’s price action is therefore unfolding within a mixed market that continues to send uneven signals.

    Traders are closely monitoring average returns, trading activity, and nearby technical levels to gauge whether the current move develops into a stronger trend or loses momentum. Regulatory clarity and institutional interest have also kept XRP in focus throughout 2026, while ongoing development on the XRP Ledger supports continued attention on the asset.

    Cryptocurrency markets remain volatile, and prices can change rapidly. Readers should conduct independent research before making investment decisions.

  • XRP Climbs to $1.11 as Ripple Boosts RLUSD Minting on XRP Ledger

    XRP Climbs to $1.11 as Ripple Boosts RLUSD Minting on XRP Ledger

    XRP rose 1.33% to trade near $1.11 within 24 hours, outperforming Bitcoin’s 0.61% increase and the broader crypto market’s 0.97% rise. The token maintained a 9.37% weekly gain, though declining trading volume indicated limited buying pressure.

    Market data points to a broad crypto recovery as the primary driver of XRP’s move. The token tracked the wider market but posted stronger gains. No clear token-specific catalyst appeared in the price data, while trading volume fell 16.26%. Traders are monitoring whether XRP can sustain support between $1.05 and $1.10 and test resistance near $1.15.

    XRP Outpaces Bitcoin as Volume Falls

    XRP’s daily gain placed it ahead of Bitcoin and the crypto market. The relative strength suggests selective demand, although the move still followed the wider market direction. The Altcoin Season Index also dropped to 46, indicating that capital has not strongly shifted into altcoins.

    The lower trading volume limits confirmation of the advance. A daily close above $1.12 could support a move toward $1.15, while a drop below $1.08 may signal weaker momentum. Bitcoin’s next move will also be critical, as a broad market decline could pressure XRP without a new coin-specific event.

    Ripple Expands RLUSD Supply on XRP Ledger

    Ripple increased RLUSD minting across the XRP Ledger (XRPL) and Ethereum, issuing a total of $291.6 million. Approximately $225.8 million, or 77%, was minted on XRPL, while Ethereum accounted for about $65.8 million.

    On July 1, Ripple minted roughly $169.8 million and burned $150,000, with nearly all issuance on XRPL. On July 2, the company minted $121.8 million and burned $68.1 million across both networks. After the two-day activity, XRPL recorded a net supply increase of $167.7 million, while Ethereum added about $55.75 million.

    The latest issuance followed a large XRPL burn at the end of June. Ripple burned about $146.3 million on June 30, producing a net supply drop of $136.1 million that day. Part of the July minting therefore replaced supply removed earlier rather than creating entirely new growth.

    RLUSD’s total supply now stands near $1.634 billion. XRPL holds about $844.5 million, or 51.7%, while Ethereum holds approximately $789.83 million, or 48.3%. The figures show a near-even split, with recent minting activity leaning toward XRPL.

    Santiment Flags Deep XRP Holder Losses

    Santiment reported that XRP’s 30-day market value-to-realized value (MVRV) ratio fell to its weakest level since December 2020. The data shows the average active trader down about 47%, placing many recent buyers in a deep loss position.

    The analytics firm said ‘fear and frustration’ had reached rare levels that previously appeared before rebounds. Still, Santiment added that ‘weak MVRV readings alone do not guarantee a reversal.’ The statement frames the data as a possible relief-rally setup, not confirmation of a durable recovery.

    Social sentiment has also turned more negative, with bullish and bearish commentary moving closer to balance. Such readings can reduce selling pressure when many holders already sit at a loss. However, XRP still needs stronger volume, stable Bitcoin trading and fresh market demand to confirm any wider rebound.

    Some market watchers are tracking a possible move toward $1.40 if XRP holds support and buying interest improves. The key levels sit near $1.05 on the downside and $1.15 on the upside, while a daily close above $1.12 could provide the first technical sign of stronger momentum.

  • Bitcoin Holds Above $61K as Ether and Solana Lead Market Recovery: June Jobs Data Eases Fed Rate Hike Fears

    Bitcoin Holds Above $61K as Ether and Solana Lead Market Recovery: June Jobs Data Eases Fed Rate Hike Fears

    Market Overview: Bitcoin Rebounds Above $61,000

    Bitcoin is trading near $61,390, up 1.28% over the past 24 hours, as a weaker-than-expected June jobs report cools expectations of a near-term Federal Reserve rate hike. The recovery has lifted the broader crypto market, with Ethereum and Solana posting stronger gains. However, analysts warn that the rally may be a relief bounce rather than a confirmed reversal, citing persistent ETF outflows, thin liquidity, and regulatory uncertainty.

    Bitcoin Price Today: Key Levels and Analyst Insights

    Bitcoin stands at $61,547.78 (CoinMarketCap), having recovered roughly $3,400 from last week’s 21-month low near $58,115. It remains well below its 52-week high above $126,000.

    Akshat Siddhant, Lead Quant Analyst at Mudrex, notes: “Bitcoin is holding strong above $61,500 after weaker US jobs data reduced rate hike expectations. However, on-chain data shows exchange inflows have climbed above 50,000 BTC per day, historically followed by increased volatility. If Bitcoin loses $60,000 support, it could retest the realized price near $53,000. On the upside, a break above $62,600 could pave the way toward $65,000.”

    The CoinSwitch Markets Desk adds: “BTC’s rebound toward $62K was driven primarily by a short squeeze. Institutional demand remains weak due to persistent ETF outflows, while higher bond yields compete with risk assets. Entering Q3, the market is healthier from a leverage perspective but more susceptible to sharp price swings.”

    Top Crypto Prices Today: Biggest Gainers

    Ethereum leads the top ten with a 4.51% gain, supported by fresh ETF inflows. Hyperliquid follows at 4.29%, extending strong momentum in derivatives trading. Solana adds 2.85%, holding gains from its recent rally toward $80. No asset in the top ten posted losses today.

    News Driving Market Sentiment

    Weak June Jobs Report Cools Rate Hike Fears

    US payrolls grew by only 57,000 in June, missing expectations by a wide margin. The soft print reduced bets on further Fed tightening, lifting risk assets including Bitcoin and Ether. Traders now see a more accommodative Fed stance, with the next policy signal expected at the July 29 FOMC meeting.

    CLARITY Act Delayed

    The White House targeted a July 4 signing, but a Senate recess pushed the vote further out. Prediction markets trimmed 2026 passage odds. XRP traders watch closely, as the bill would set clearer digital asset rules.

    Citi Cuts Bitcoin and Ether Price Targets

    Citi lowered its 12-month Bitcoin forecast from $112,000 to $82,000 and Ether from $3,175 to $2,240, citing weak ETF flows and softer investor appetite. The bear case places Bitcoin near $53,000 if outflows persist.

    JPMorgan Flags Risk in Strategy’s Bitcoin Sales Policy

    JPMorgan said Strategy’s approach to selling Bitcoin adds unnecessary market uncertainty. The bank recommended equity issuance instead, adding scrutiny to corporate treasury strategies tied to Bitcoin.

    Investor and Market Outlook

    Bitcoin’s hold above $61,000 marks a steadier session, but most desks call it a relief bounce. The $60,000–$61,000 zone is key support. A break below could reopen the path toward $58,000, then realized price near $53,000. On the upside, $62,600 and $65,000 are targets for bulls. Ether’s strength above $1,650 and Hyperliquid’s climb suggest capital rotation into higher-beta names. Investors should track daily ETF flows, the CLARITY Act’s delayed Senate vote, and Fed commentary ahead of the July 29 FOMC meeting.

    Frequently Asked Questions

    What is the Bitcoin price today?

    Bitcoin is trading near $61,390.46, up 1.28% over 24 hours. Support near $60,000, resistance at $62,600 and $65,000.

    Why did Bitcoin recover this week?

    A weaker-than-expected June jobs report cooled Fed rate hike expectations, lifting Bitcoin and broader risk assets.

    What is the biggest crypto news today?

    The CLARITY Act’s delayed July 4 deadline, Citi’s price target cuts, and JPMorgan’s note on Strategy’s Bitcoin sales policy.

    Which coins are gaining the most today?

    Ethereum (+4.51%), Hyperliquid (+4.29%), and Solana (+2.85%) lead gains. No top-ten coin posted losses.

    What should crypto investors watch this week?

    Daily ETF flow data, CLARITY Act Senate vote, Fed commentary, and the $60,000 Bitcoin support level.

    Disclaimer: This article is for informational purposes only and does not constitute investment advice. Cryptocurrencies are risky assets; always conduct your own research before investing.

  • Solana Price Forecast July 2026: Strong Recovery, Network Growth, and $100 Target

    Solana Price Forecast July 2026: Strong Recovery, Network Growth, and $100 Target

    Solana has entered July 2026 with fresh momentum after several difficult weeks in the crypto market. After sharp price swings during the second quarter of 2026, Solana has started July on a much stronger note, which has pushed analysts to closely examine how the asset may perform over the coming weeks.

    Current Solana Price Shows Recovery

    At the beginning of July 2026, Solana (SOL) trades between $80 and $85, which marks a strong recovery from the June low levels near $66 to $70. During the last seven days alone, the token has recorded gains of nearly 16%, making it one of the strongest-performing major cryptocurrencies at the start of the month.

    Solana’s market capitalization now sits close to $43 billion, which helps it maintain its place among the largest blockchain networks in the crypto industry. The recent recovery has shown that buyers continue to defend important support zones after weeks of market pressure.

    Network Growth Creates Strong Foundation

    One of the biggest positive signals for Solana this month comes from strong network activity. Recent blockchain data shows that active wallet addresses now approach nearly 7 million, which stands among the highest activity levels seen during 2026 so far.

    This growth clearly shows that more people continue to use the Solana blockchain across different sectors. Activity remains strong in decentralized finance applications, NFT marketplaces, blockchain gaming, and consumer-focused crypto products.

    Solana has continued to attract developers mainly for two important strengths. First, transaction fees remain very low compared to competing networks. Second, the blockchain continues to process transactions at very high speed.

    New Ecosystem Development Supports Confidence

    The platform has received attention as it now works inside the Phantom Wallet ecosystem, which remains one of the most popular wallet services for Solana users. The system uses decentralized oracle technology powered by Chainlink and allows market participation across crypto price predictions, sports outcomes, and global financial events.

    Technical Charts Show Bullish Structure

    From a technical market perspective, Solana recently moved above a major resistance level near $75, which has created a stronger short-term market structure.

    At present, the first major support zone sits near $73, while stronger support remains around $70. On the upside, analysts now watch $90 as the first major resistance area.

    If buying pressure continues at current levels, Solana may soon attempt a move toward the important $100 price zone. Some analysts believe a strong breakout could even push prices toward $120 before the end of July.

    July Price Forecast Looks Positive

    Under weaker market conditions, analysts believe the price could fall back toward the $70 to $73 range, especially if Bitcoin experiences another correction.

    Under normal market conditions, Solana may continue trading between $82 and $95 for most of July as buyers and sellers search for direction. Under stronger bullish conditions, analysts believe Solana could rise toward $100 to $120 before the month ends.

    Risks Still Remain in the Market

    Global crypto regulations remain uncertain, and sudden policy changes can create strong price volatility across the entire market. Broader economic conditions also remain important since interest rate decisions continue to influence investor behavior across risk assets, including cryptocurrencies.

    Bitcoin price action also remains a major factor. If Bitcoin faces sudden selling pressure, Solana may also experience short-term weakness regardless of its own positive fundamentals.

    Why This Matters

    Solana rebounded because buyers actively defended key support levels. The network currently has nearly 7 million active wallets and very low transaction fees. Spot ETF assets also crossed the $1 billion mark, showing real network growth instead of speculative hype.

    Final Outlook for July 2026

    July 2026 has become an important month for Solana as several positive factors now come together at the same time.

    Strong wallet growth, expanding blockchain usage, new ecosystem launches, and improving technical charts all support a positive short-term outlook. Current expectations suggest Solana will likely trade between $80 and $100 through much of the month.

    If market conditions stay favorable and buying pressure remains strong, price movement toward $120 remains possible before July closes.

    FAQs

    1. What is Solana’s price at the start of July 2026?

    Solana currently trades between $80 and $85. This shows a strong recovery of nearly 16% from its previous June lows, which sat around the $66 to $70 range.

    2. What factors are driving Solana’s price up this month?

    The rally is driven by strong network fundamentals, active wallets nearing 7 million, low transaction fees, and fresh ecosystem developments like new prediction integrations within the popular Phantom Wallet app.

    3. Can Solana hit $100 or $120 in July 2026?

    Yes, technical charts show a bullish structure after clearing $75. If buying momentum continues, analysts expect a move toward $100, with an extended breakout potentially hitting $120 this month.

    4. What are the key support and resistance levels to watch?

    Solana faces immediate resistance at $90, with major targets at $100 and $120. On the downside, immediate support sits at $73, while a stronger floor remains down at $70.

    5. What are the biggest risks to Solana’s positive outlook?

    The main short-term risks include sudden Bitcoin selling pressure pulling down the market, ongoing global crypto regulatory uncertainty, and broader macroeconomic factors like upcoming central bank interest rate decisions.

  • Dogecoin Breaks Critical $0.08 Support – What It Means for Investors

    Dogecoin Breaks Critical $0.08 Support – What It Means for Investors

    Dogecoin recently fell below the important $0.08 support level after losing nearly 40% in recent weeks, creating uncertainty as traders watch for possible recovery or deeper price correction ahead.

    Key Takeaways

    • Dogecoin dropped below $0.08, a major support level that held strong for months.
    • DOGE futures open interest fell 10%, showing weaker trader confidence in the short term.
    • Elon Musk and ETF speculation continue to keep long-term market interest alive despite current weakness.

    As of early July 2026, Dogecoin trades between $0.07 and $0.08. The meme cryptocurrency has already lost nearly 35% to 40% of its value in recent weeks after reaching highs close to $0.10 to $0.12 during May.

    Why This Price Drop Matters

    Support levels play an important role in technical analysis since they often mark areas where buyers become active. For several months, Dogecoin remained inside a price range between $0.08 and $0.12. The recent move below $0.08 changed market sentiment as it showed that sellers currently hold more control than buyers.

    When a support level breaks, that same level often becomes resistance. In simple terms, this means if Dogecoin attempts recovery, heavy selling pressure may return near the same price area. Right now, experts believe the next important price zone sits between $0.065 and $0.070. If this area fails, further decline may follow.

    Main Reasons Behind the Recent Decline

    The overall cryptocurrency market has struggled in recent weeks, especially after Bitcoin failed to remain above major resistance levels. Dogecoin usually follows Bitcoin’s direction, but price swings are often much larger because it depends heavily on market sentiment and speculation.

    Another important factor comes from the futures market. Recent reports show that DOGE futures open interest fell by nearly 10% within just 24 hours. Open interest represents the number of active futures contracts. A sudden drop usually shows reduced trader confidence and weaker short-term demand.

    Selling pressure also increased after Dogecoin failed to move above $0.09. Many traders expected a recovery rally, but the price rejection at that level pushed more investors toward profit-booking, which added extra pressure on the market.

    Positive Signs Still Exist

    Recent reports suggest growing institutional interest in meme-based cryptocurrencies. Large investment firms continue discussions about possible crypto products tied to Dogecoin, including market speculation about future Dogecoin ETFs. This keeps long-term market attention alive.

    Another positive development came after Dogecoin recently broke out of a seven-month downtrend. This technical signal often shows that a larger recovery may still happen if buying demand returns at lower price levels.

    Trading volume also remains relatively stable compared with many smaller meme coins. This shows Dogecoin still holds strong market presence and remains one of the most actively traded meme cryptocurrencies.

    Elon Musk Factor Still Matters

    Dogecoin remains closely tied to Elon Musk, whose public comments have often influenced its price movements in the past. Market attention remains focused on potential payment features associated with X Corp, formerly known as Twitter. Speculation continues about whether Dogecoin may gain future payment utility within Musk’s business ecosystem.

    Important Price Levels Ahead

    Dogecoin now stands near an important decision point. The immediate support level sits near $0.065, while $0.07 remains an important psychological level for traders. For recovery, Dogecoin first needs to move back above $0.08. After that, the next major resistance zone sits between $0.09 and $0.10.

    What Investors Should Understand

    The most recent breakdown further illustrates how risky meme coins can be in comparison with traditional assets, as Dogecoin’s future value is determined primarily by social media trends, community interest, speculation, and the direction of the greater cryptocurrency market. At this time, the lack of strong support in the cryptocurrency market is keeping many short-term traders cautious. Long-term investors are still focused on long-term possibilities of wider use cases, payment integration, and potential for a full recovery of the market.

    Frequently Asked Questions

    1. Why did the Dogecoin price fall recently?

    Dogecoin collapsed given a combination of overall cryptocurrency market weakness, a sudden 10% drop in futures open interest, and failure to break key resistance at $0.09, which triggered heavy profit-taking.

    2. What is Dogecoin’s current price range?

    As of early July 2026, Dogecoin is trading heavily suppressed within a tight range of $0.07 to $0.08, having shed up to 40% of its value since May.

    3. What happens after Dogecoin breaks a major support level?

    When a support floor like $0.08 breaks, it structurally flips into a resistance level. This means any future attempt at a recovery rally will face intense selling pressure at that exact price point.

    4. What are the key technical levels to watch next?

    Traders are closely watching immediate downside support between $0.065 and $0.070. On the upside, DOGE must firmly reclaim $0.08 before it can challenge the $0.09 to $0.10 resistance zone.

    5. Why does Elon Musk continue to impact Dogecoin’s value?

    Dogecoin remains highly sensitive to speculation surrounding Elon Musk. Traders consistently price in high-risk bets on whether DOGE will eventually be integrated as an official utility token for payment features on X.

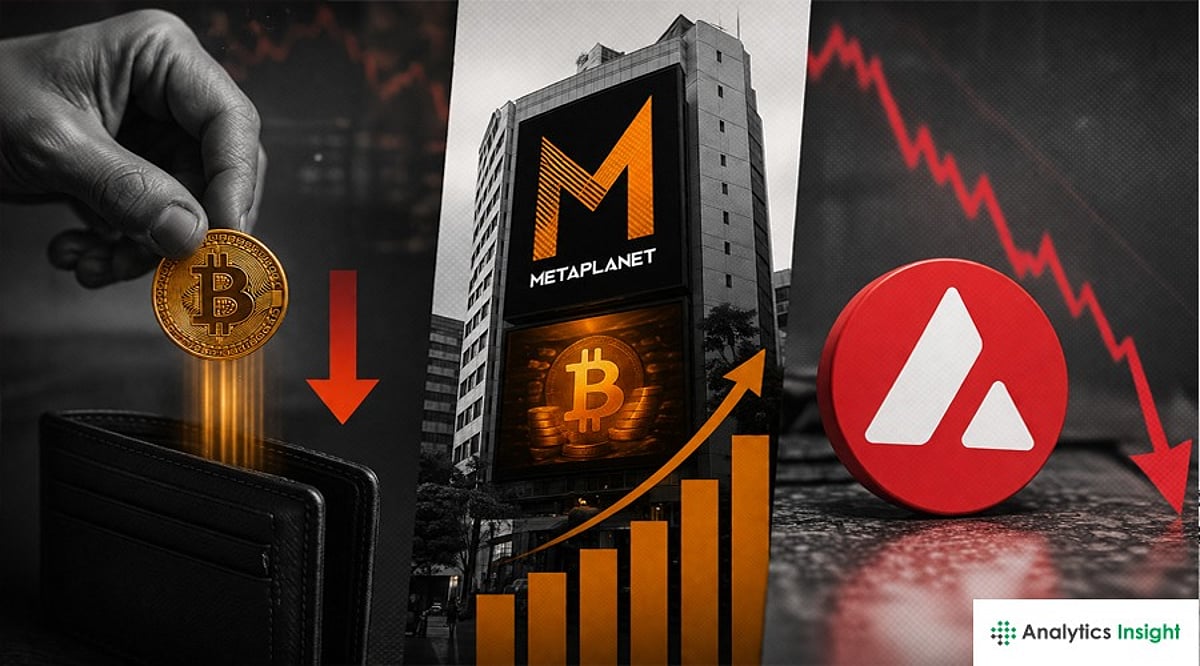
  • Bitcoin ETFs See $294M Outflow, Metaplanet Revenue Hits ¥11.4B, Avalanche Stock Plunges 73%

    Bitcoin ETFs See $294M Outflow, Metaplanet Revenue Hits ¥11.4B, Avalanche Stock Plunges 73%

    The crypto market witnessed major developments as Bitcoin spot ETFs reported $294.62 million in net outflows, while XRP whales accumulated during the price dip. Meanwhile, Metaplanet disclosed its BTC revenue and Avalanche Treasury stock fell.

    Bitcoin Saw $294 Million in Outflows

    According to SoSoValue, the Bitcoin spot ETF saw a total net outflow of $294.62 million yesterday. The Bitcoin Spot ETF with the highest net inflow yesterday was the Grayscale Bitcoin Mini Trust ETF $BTC, with a daily net inflow of $36.33 million. The second highest was Morgan Stanley’s ETF MSBT, with a daily net inflow of $29.81 million, and the total historical net inflow of MSBT currently stands at $364.01 million. The Bitcoin Spot ETF with the highest net outflow yesterday was BlackRock’s ETF IBIT, with a daily net outflow of $219.39 million, and the total historical net inflow of IBIT currently stands at $60.03 billion. The total net asset value of Bitcoin Spot ETFs is $72.46 billion, with an ETF net asset ratio of 6.01%. The historical cumulative net inflow has reached $50.86 billion.

    XRP Whales are Accumulating

    According to market analyst Xaif Crypto, XRP’s drop to $1.04 appears to have triggered fear among smaller traders, but large investors saw it as a buying opportunity. XRP has since recovered to $1.06. A key indicator is the All CEX whale spread, which has climbed to 50.9%, signaling that whales now control a significantly larger share of XRP held on centralized exchanges. Coinbase whale outflows have surged. Transfers of more than 1 million XRP jumped from 10% to 25.7% of total exchange activity in just two weeks. Large withdrawals are widely viewed as a bullish signal, suggesting investors are moving tokens into private wallets for long-term holding instead of preparing to sell.

    Metaplanet Reports Bitcoin Income Business Revenue

    Japanese listed company Metaplanet released results for its Bitcoin income business revenue in the second quarter of fiscal 2026. According to Foresight News, the business recorded operating revenue of 1.75 billion yen in the second quarter. Metaplanet said cumulative revenue for the first half of the fiscal year reached 4.72 billion yen. The company added that over the past 12 months, cumulative revenue from its Bitcoin income business totaled 11.4 billion yen.

    Ethereum Posts Historic Third Straight Losing Quarter

    The second-largest cryptocurrency has fallen victim to the prolonged bear market as the second quarter closed. This makes it the asset’s third consecutive quarterly loss. Since reaching its all-time high of nearly $5,000 in August 2025, the price of the cryptocurrency has maintained a steady downward trajectory. Data from CoinGecko reveals that the asset is now trading around $1,560, representing a 70% contraction from its peak price. Historically, the month of July does not usually favor the platform’s performance, having closed lower in six of the last ten years.

    Avalanche Treasury Stock Collapses

    Avalanche Treasury Co. shares have fallen sharply since their Nasdaq debut as lower AVAX prices have weighed on the company’s digital asset holdings. The AVAX-focused digital asset treasury firm began trading under the ticker AVAT on June 11. The stock recently traded near $0.50, down about 73% from its $1.85 close on debut. AVAX recently traded near $6.69, up 0.94% over 24 hours but down 23% over the past month. Avalanche Treasury reported a net loss of $26.78 million for the quarter ended March 31, according to its latest SEC filing. The company also reported $1.22 million in cash and a net working capital deficit of $9.06 million at quarter-end.

    FAQs

    1. How much outflow did Bitcoin spot ETFs record?
    According to SoSoValue, Bitcoin spot ETFs recorded total net outflows of $294.62 million yesterday. BlackRock’s IBIT saw the largest withdrawal at $219.39 million.

    2. Which Bitcoin ETF saw the highest inflow?
    The Grayscale Bitcoin Mini Trust ETF recorded the highest daily inflow at $36.33 million. Morgan Stanley’s MSBT followed with $29.81 million in daily inflows, taking its historical inflow to $364.01 million.

    3. Why are XRP whales accumulating?
    According to market analyst Xaif Crypto, XRP’s fall to $1.04 created fear among smaller traders but attracted larger investors. Coinbase whale transfers above 1 million XRP rose from 10% to 25.7% of exchange activity in two weeks.

    4. How much revenue did Metaplanet report from its Bitcoin income business?
    According to Foresight News, Metaplanet’s Bitcoin income business generated ¥1.75 billion in operating revenue during Q2 FY2026. The company said revenue reached ¥4.72 billion in the first half and ¥11.4 billion over the past 12 months.

    5. Why did Avalanche Treasury stock fall sharply?
    Avalanche Treasury stock has dropped around 73% from its Nasdaq debut close as weaker AVAX prices pressured its digital asset holdings. The company also reported a quarterly net loss of $26.78 million and a working capital deficit of $9.06 million.

  • Bitcoin Bounces Above $60K as Long-Term Holders Resume Accumulation

    Bitcoin Bounces Above $60K as Long-Term Holders Resume Accumulation

    Bitcoin recovered to around $60,350 on July 2, gaining 2.37% in 24 hours as the US dollar and crude oil prices dropped to four-month lows. The rebound followed a dip to a 21-month low earlier in the week, with improved risk sentiment helping the cryptocurrency reclaim the key $60,000 level.

    Weaker Dollar Supports Bitcoin’s Recovery

    CoinSwitch noted that the dollar’s retreat created a favorable environment for Bitcoin, as long-term investors increased their holdings during the recent market decline. The firm reported that long-term holders added 270,000 BTC within two weeks, absorbing some of the selling pressure from spot Bitcoin exchange-traded fund (ETF) outflows.

    Funding rates remained positive for three consecutive days, indicating that derivatives traders continued to favor long positions despite June’s steep decline. CoinSwitch advised traders to wait for a confirmed close above $61,000 before treating the rebound as a reliable shift in Bitcoin’s short-term direction.

    ETF Outflows Meet Renewed Accumulation

    Spot Bitcoin ETFs recorded $4.5 billion in net outflows during June, adding selling pressure as Bitcoin lost about 20% across the month. However, Glassnode data showed that the long-term holder net position change returned to positive territory after an extended period of distribution.

    The indicator tracks the 30-day supply change among wallets holding Bitcoin for at least 155 days, which Glassnode classifies as long-term holders. Current net accumulation ranges between approximately 50,000 and 100,000 BTC, according to Glassnode’s chart. Previous bullish buying waves approached 400,000 BTC.

    Glassnode said transitions from distribution to accumulation have often appeared during weak markets, as committed investors increase exposure while shorter-term participants reduce risk.

    Buying Spreads Across Bitcoin Wallet Groups

    Glassnode’s Accumulation Trend Score increased over the past month, suggesting that buying expanded across several wallet groups rather than remaining concentrated within one category.

    • Wallets holding less than one BTC recorded the strongest score, near 0.8 to 0.9.
    • Holders of between 100 and 1,000 BTC showed similar accumulation.
    • Wallets holding between one and 100 BTC posted moderate readings of about 0.6 to 0.7.
    • Wallets containing 1,000 to 10,000 BTC also became net buyers.

    By contrast, wallets holding more than 10,000 BTC remained near neutral, with readings around 0.4 to 0.5 and limited evidence of aggressive accumulation. Glassnode said widespread buying can support longer-term market recoveries, but cautioned that Bitcoin has not entered a complete accumulation phase.

    Meanwhile, investors continued monitoring the upcoming US nonfarm payrolls report, which could influence expectations surrounding the Federal Reserve’s interest-rate outlook. Mudrex Lead Quant Analyst Akshat Siddhant identified $61,000 as the next important upside level, while $58,300 remained Bitcoin’s main support area.

    What’s Next?

    Bitcoin’s rebound above $60,000 gained support from a weaker US dollar and renewed accumulation by long-term holders, although ETF outflows and cautious whale activity still limit confidence. Traders should watch for a confirmed break above $61,000 and the $58,300 support level before judging whether the recovery can continue.

  • Solana and Hyperliquid ETF Inflows Surge as XRP Funds Face Steady Outflows

    Solana and Hyperliquid ETF Inflows Surge as XRP Funds Face Steady Outflows

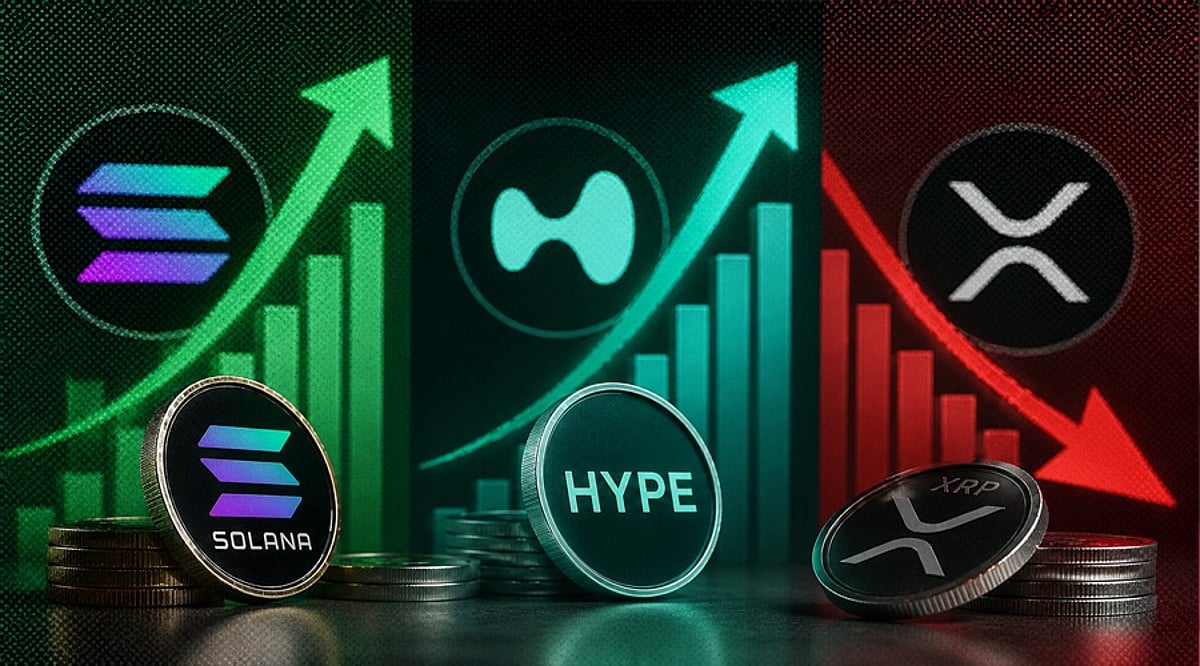
    Spot cryptocurrency ETFs tied to Solana and Hyperliquid saw fresh capital inflows on July 1, while XRP funds recorded withdrawals amid selective demand across digital asset markets. Data from SoSoValue shows Solana spot ETFs posted approximately $500,000 in net inflows, while Hyperliquid funds gained $2.9 million. In contrast, XRP spot ETFs registered $1.86 million in net outflows.

    The divergent flows highlight that investors continue to direct capital toward specific assets rather than the broader crypto market. Daily ETF flows often reflect shifting demand, portfolio rebalancing, profit-taking, or reduced risk appetite.

    Solana Price Recovery Attracts Renewed Interest

    Solana traded above $78 on Thursday, gaining nearly 10% over the week. Stronger derivatives data, modest fund demand, and improving technical momentum supported the recovery. CoinGlass data shows Solana’s long-to-short ratio at 1.11, its highest level in more than a month. A ratio above one indicates bullish positions outnumber bearish positions.

    Solana’s funding rate also turned positive, reaching 0.0017% on Thursday. Positive funding means long traders pay short traders, signaling stronger demand for upward price exposure.

    According to SoSoValue, Solana spot ETFs attracted $521,070 on Wednesday, contributing to a cumulative $3.55 million in net inflows through Wednesday. While the flow remains modest, it aligns with improving market indicators. Further inflows could support price demand if the trend continues and strengthens.

    Hyperliquid Gains While XRP Funds Experience Capital Losses

    Hyperliquid spot ETFs recorded $2.9 million in net inflows on July 1, surpassing Solana’s daily total. The protocol has gained attention among traders using on-chain derivatives. Meanwhile, XRP spot ETFs moved in the opposite direction, posting $1.86 million in withdrawals. The outflows reflect weaker daily demand compared with Solana and Hyperliquid products.

    XRP remains linked to ongoing legal proceedings between Ripple Labs and the U.S. Securities and Exchange Commission, and the uncertainty has contributed to cautious investor sentiment. At the same time, the Solana Foundation introduced Solana Governance Proposals, establishing an on-chain process for major network decisions. Validators can submit, support, and vote on broad governance questions.

    The framework limits proposals to high-level network direction rather than detailed technical changes. Validators use the svmgov program to conduct stake-weighted voting. A validator vote account must hold at least 100,000 SOL in delegated stake before placing a proposal on-chain. The proposal then requires support from 15% of active stakeholders. Validators prove voting weight through Merkle proofs linked to an on-chain stake snapshot. The process gives validators a formal avenue to shape major questions about Solana’s future direction.

    What’s Next for Crypto ETFs?

    Solana and Hyperliquid ETFs attracted fresh capital, while XRP funds recorded notable withdrawals. Solana also gained support from improved derivatives data, price recovery, and new validator governance measures. Investors should monitor ETF flows, market positioning, and network developments for clearer signals about future demand.