Category: Cryptocurrency

  • Crypto at a Crossroads: MiCA Deadline and US Jobs Report Fuel Market Uncertainty

    Crypto at a Crossroads: MiCA Deadline and US Jobs Report Fuel Market Uncertainty

    As July begins, the cryptocurrency market faces a confluence of events that could reshape trading dynamics across Europe and the United States. The European Union’s MiCA transitional period expires on July 1, forcing crypto-asset service providers to obtain full authorization or cease serving EU customers. At the same time, Robinhood prepares to unveil new products, while the U.S. Bureau of Labor Statistics releases the June employment report. These developments, combined with potential geopolitical shocks and thinner holiday liquidity, may drive significant volatility for Bitcoin and other digital assets.

    MiCA Deadline Redraws Europe’s Crypto Landscape

    The expiration of the MiCA transitional period ends temporary national arrangements for crypto companies operating under earlier local rules. From July 1, all crypto-asset service providers must hold full authorization under the European Union’s unified licensing framework or stop offering services to EU customers. Authorized firms can now operate across participating European markets with a single license, while unauthorized ones must restrict new accounts, transfer users, reduce product access, or begin orderly shutdowns.

    Binance, failing to secure a MiCA license, has created an opening for competing exchanges to target its customer base. Users may face account migrations, changes in stablecoin access, fewer trading pairs, or new legal entities holding their assets. The European Securities and Markets Authority urges customers to verify whether their providers appear on the MiCA register. Large-scale user movements between platforms could also dampen euro-denominated trading volumes and token liquidity.

    Robinhood Plans New Crypto Product Reveal

    Robinhood will host an event featuring CEO Vlad Tenev and crypto general manager Johann Kerbrat to announce new products, though details remain scarce. The event occurs as financial platforms compete for customers during Europe’s regulatory transition. Market participants will watch for information about product access, supported markets, and how these services fit into Robinhood’s broader crypto business. Any immediate effect will depend on the specifics of the announcement and the timing of availability.

    U.S. Jobs Report Could Shift Rate Expectations

    The Bureau of Labor Statistics will release the June employment report on Thursday at 8:30 a.m. Eastern Time, ahead of the Independence Day holiday on July 3. A Reuters poll expects 110,000 additional nonfarm jobs—a slowdown from May. Traders will scrutinize unemployment, wage growth, and revisions alongside the headline figure. A stronger report could lift Treasury yields and the dollar by reducing expectations for easier Federal Reserve policy, potentially pressuring Bitcoin and other rate-sensitive assets. A weaker report could support risk assets if it lowers rate expectations without raising deeper economic concerns.

    Before Thursday, job openings, private payrolls, unemployment claims, and the ISM manufacturing index will offer additional signals. European inflation data, the ECB forum, and geopolitical risks may also influence currencies, yields, and crypto demand.

    As the week unfolds, the MiCA deadline, Robinhood’s product event, and the U.S. jobs report will likely shape market sentiment. Regulatory changes may affect European exchange access, while economic data could influence Bitcoin volatility and interest-rate expectations. Traders are advised to follow official announcements and market signals before making major decisions.
  • Bitcoin, Ethereum, XRP Find Footing as Traders Eye Key Support Levels and Macro Data

    Bitcoin, Ethereum, XRP Find Footing as Traders Eye Key Support Levels and Macro Data

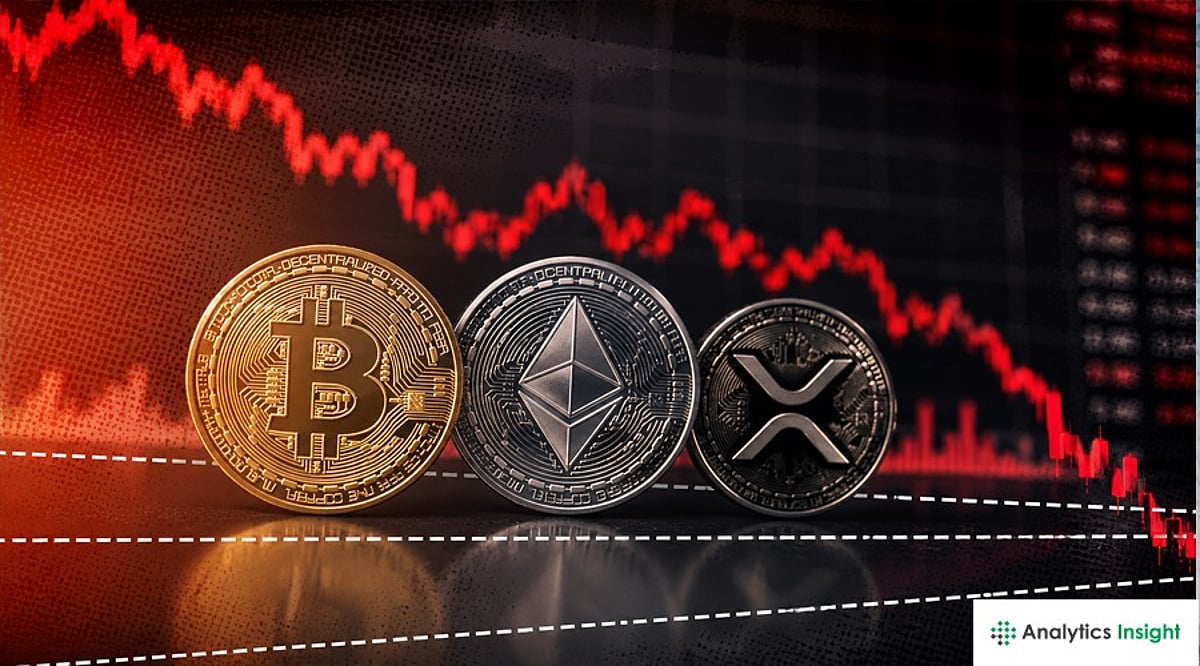
    Bitcoin, Ethereum, and XRP started the new week with signs of stability after posting steep losses during the previous trading sessions. The three largest cryptocurrencies by market capitalization remain under technical pressure, but recent price action shows that selling has slowed near important support levels.

    Bitcoin recovered near $60,000, Ethereum continued to trade above $1,500, and XRP defended the $1.00 mark. At the same time, traders continued monitoring macroeconomic developments, exchange flows, and technical indicators for signs of the market’s next move.

    Bitcoin Holds Above $60,000 While Recovery Faces Resistance

    Bitcoin traded back above $60,000 after falling nearly 6% over the previous week. The rebound came as the market attempted to stabilize following broad selling across digital assets. Despite the recovery, Bitcoin remained below its 50-day, 100-day, and 200-day exponential moving averages, showing that the broader trend has not changed.

    The Relative Strength Index (RSI) stayed close to 33, placing Bitcoin just above oversold conditions. The MACD also remained slightly negative, although selling momentum appeared to weaken. Traders continued watching resistance around $64,000, followed by the major moving averages near $66,971, $70,591, and $76,516. Until those levels are reclaimed, the latest recovery remains limited.

    Ethereum and XRP Defend Key Price Levels

    Ethereum traded near $1,585 and continued holding above the $1,500 support area. The asset also remained below its major moving averages, leaving the broader technical structure under pressure. However, the RSI remained near oversold territory, while the MACD turned slightly positive, showing that downside momentum had eased.

    If Ethereum continues higher, resistance stands near the 50-day EMA around $1,833, followed by the $2,000 area and the 100-day EMA near $2,010. On the downside, traders continued watching $1,500 closely because a break below this level could expose support near $1,385.

    XRP traded around $1.05 while defending the psychological $1.00 support level. The token also stayed below its major moving averages and beneath a descending price channel. Its RSI remained near 33, while the MACD continued to show weak momentum. Resistance remained near $1.19, followed by $1.21 and $1.30.

    Exchange Flows and Macro Events Remain in Focus

    Market participants also monitored activity on Binance after the exchange recorded more than $400 million in weekly net outflows during the week beginning June 22. The reported outflows represented a small share of the exchange’s total tracked assets, although Binance recorded the largest weekly net outflows among major exchanges.

    The movement came ahead of the European Union’s Markets in Crypto-Assets (MiCA) transition deadline and followed Binance’s withdrawal of its MiCA license application in Greece. Broader market conditions also remained tied to global developments. Reports that the United States and Iran agreed to halt strikes and resume talks lifted equity futures, but cryptocurrencies showed only a limited response.

    Bitcoin traded near $59,700, while Ether posted modest gains and XRP remained under pressure. Market participants also continued monitoring upcoming US economic data, including the Personal Consumption Expenditures (PCE) report, for additional direction.

    For now, Bitcoin, Ethereum, and XRP have stabilized near important support levels. Traders continue watching whether buyers can maintain those areas while the market reacts to technical signals and broader economic developments.

  • XRP Active Addresses Jump 72% as Bulls Defend $1 Support Level

    XRP Active Addresses Jump 72% as Bulls Defend $1 Support Level

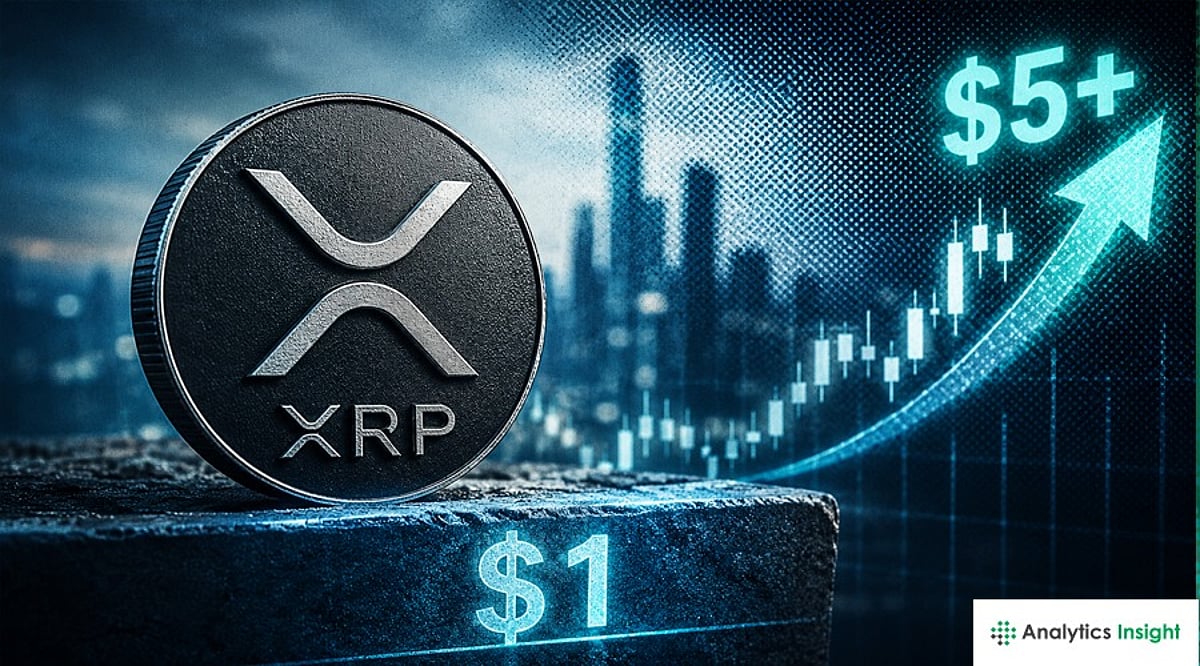
    XRP is attracting fresh market attention after a sharp rise in network activity, even as the cryptocurrency continues to trade close to an important support level. Data from Santiment showed daily active addresses increased from about 23,000 on June 14 to nearly 39,500 by June 27.

    Technical signals remain mixed. XRP still trades below key moving averages although some chart patterns suggest selling pressure may be starting to ease. Market participants are now watching whether buyers can defend support around the $1.04 to $1.06 range.

    Active addresses rise as XRP holds key support

    Daily active addresses climbed by roughly 72% over two weeks, according to data shared by crypto analyst Ali Martinez, based on Santiment metrics. The increase reflects more wallets interacting with the XRP Ledger during a period when the token continued trading near $1.05. Higher blockchain activity suggests that more users are active on the network.

    In addition, market analysts point to accumulation by large holders during the recent market decline. However, weak sentiment across the broader cryptocurrency market has continued to weigh on XRP. Furthermore, the token remains well below the price levels it traded at earlier this year.

    Some analysts stated that XRP price may be forming a base instead of extending its decline. They noted that holding above the psychological $1 support remains important for the current market structure.

    Technical signals point to possible recovery

    Several technical indicators now suggest that selling pressure may be slowing. Analysts identified a Tom DeMark Sequential buy signal together with a Morning Star Doji pattern on the daily chart. These formations often appear after extended declines although they do not guarantee a reversal.

    Analysts also noted that XRP needs to establish support between $1.07 and $1.10 before buyers can target higher resistance levels. A sustained move above that range could shift attention toward $1.15, followed by $1.21 and possibly $1.30 if buying volume strengthens.

    The Relative Strength Index has also moved closer to oversold territory. Crypto analyst CryptoLlica said the indicator reached its lowest reading in more than 13 years. According to the analyst, “the RSI has reached its most oversold level since XRP launched.” Market participants continue monitoring whether this condition leads to renewed buying interest.

    Despite these signals, XRP remains below its 50-day and 200-day simple moving averages. These levels indicate that the broader trend has not yet turned bullish.

    Analysts focus on resistance levels and market catalysts

    Open interest in XRP derivatives has declined from about $1.18 billion to nearly $1.04 billion. Funding rates have also turned negative after recent long liquidations reduced leveraged positions. Analysts said the reset could reduce downside pressure if spot demand improves.

    Technical indicators still show limited momentum. The MACD remains close to neutral, while the Stochastic Oscillator and Ultimate Oscillator suggest the market has not yet established a clear direction. As a result, traders continue watching the $1.04 to $1.06 support zone for confirmation of the next move.

    Market forecasts also remain conditional. According to an analysis, “if XRP holds above the $1 support while network activity continues rising, the price could move toward the $1.20 to $1.35 range.” The same outlook noted that a break below $1 would weaken the recovery scenario.

    Beyond price action, analysts are also monitoring developments surrounding tokenized real-world assets. Reports estimate that the XRP Ledger hosts about $330 million in tokenized RWAs, while Stellar manages a much larger share of that market. Traders are also watching the proposed CLARITY Act in the United States which could become another factor influencing institutional sentiment if lawmakers advance the legislation in July.

  • Bitcoin Hovers Near $59.5K, Ethereum Trades at $1,580 as US-Iran Tensions and Record ETF Outflows Rock Markets

    Bitcoin Hovers Near $59.5K, Ethereum Trades at $1,580 as US-Iran Tensions and Record ETF Outflows Rock Markets

    Bitcoin is navigating its weakest June in four years, trading near $59,427, as a combination of renewed US-Iran geopolitical tensions, a historic $4 billion monthly ETF outflow record, and hawkish Federal Reserve expectations compress price action into a critical $58,000–$61,000 range. Ethereum is holding around $1,580, with both major cryptocurrencies facing headwinds from institutional capital rotation and macroeconomic uncertainty.

    Bitcoin Price Today: $59,427

    Bitcoin is down 0.90% over 24 hours and roughly 6.80% on the week. The token has spent most of June below the $62,000 resistance cluster, failing repeatedly to reclaim key moving averages overhead. A weekly close below $60,000 keeps the near-term bias firmly to the downside. The $58,000 level is now the most actively defended support on the chart. A confirmed break below it opens a path toward $55,000, with some analysts flagging $52,000 as the next structural floor. On the upside, reclaiming $61,200–$62,500 with volume is the prerequisite for any meaningful recovery toward $64,000–$66,000.

    “Bitcoin continues to trade in a tight $58,000–$61,000 range as investors weigh renewed geopolitical tensions in the Middle East against weakening institutional demand. BTC is on track to end June down nearly 19%, marking its weakest monthly performance since mid-2022. Spot Bitcoin ETFs have also recorded more than $4 billion in net outflows this month, the largest monthly withdrawal since their launch.” — Akshat Siddhant, Lead Quant Analyst at Mudrex

    “Bitcoin is down nearly 7% on the week, with altcoins taking an even bigger hit. Both Bitcoin and Ether are on track to finish the second quarter in the red, marking back-to-back losing quarters to start the year. For Bitcoin, this is only the third time it has started the year with two straight losing quarters.” — Piyush Walke, Derivatives Research Analyst at Delta Exchange

    Ethereum Price Today: Around $1,580

    Ethereum is trading near $1,580, under pressure but still holding above the key $1,500 support level. A break below $1,500 could trigger a deeper decline toward $1,440, according to analysts.

    Market Drivers

    US-Iran Ceasefire Tensions Reignite

    Weekend military exchanges between the US and Iran tested the fragile ceasefire that had been holding since April. While both sides have paused strikes for now, the Strait of Hormuz remains a pressure point for global oil flows. Elevated crude prices compound inflation concerns, adding to the hawkish Fed narrative and suppressing risk appetite across crypto markets.

    Record ETF Outflows

    Spot Bitcoin ETFs are on track for their worst monthly outflow since launch in January 2024, with cumulative June redemptions exceeding $4 billion. Weekly redemptions last week hit $1.79 billion, pushing cumulative net inflows from over $66 billion down to approximately $51 billion. BlackRock’s IBIT has absorbed the largest share of redemptions. Capital continues to rotate toward AI-linked equities, drawing risk appetite away from crypto.

    Strategy’s Valuation Falls Below Bitcoin Holdings

    Strategy Inc., the largest single corporate Bitcoin holder with over 847,000 BTC, has seen its market valuation fall below the worth of its own coin holdings. The company’s preferred stock (STRC) has slipped to record lows, triggering concerns it may need to sell Bitcoin to meet dividend obligations. Ripple CEO Brad Garlinghouse criticized the funding model as financial engineering.

    CZ Attributes Decline to AI Competition

    Binance founder Changpeng Zhao noted that crypto’s roughly 50% decline over the past year is due to the gravitational pull of AI infrastructure spending, geopolitical tensions, and the typical four-year halving cycle. US hyperscalers are projected to spend over $700 billion on AI infrastructure this year, competing directly for speculative capital.

    Top 10 Crypto Movers

    • Gainer: TRON (+0.75%) — Relative resilience supported by consistent stablecoin transfer volumes.
    • Losers: Dogecoin (-2.41%), BNB (-1.29%), Solana (-0.42%) — High-beta assets continue to bleed amid macro-driven selloff.

    Fear and Greed Index

    The Fear and Greed Index sits near 18, deep in “Extreme Fear,” reflecting broad caution heading into the final trading days of June.

    Investor Outlook

    Bitcoin enters the final two trading days of June in a structurally weak position. The $58,000–$59,000 support band is the market’s last meaningful floor before a deeper move toward $52,000. July has historically delivered average Bitcoin returns of 7.6% to 10.3%, offering a seasonal tailwind if sentiment improves, but requires a macro catalyst to activate.

    Investors should monitor daily ETF flow data from SoSoValue, geopolitical headlines out of the Middle East, and the Dollar Index. Avoiding leverage and maintaining tight risk management remains the practical priority until $60,000 is reclaimed with conviction.

    FAQs

    What is the Bitcoin price today? Bitcoin is trading near $59,427, down 0.90% over 24 hours. Support sits at $58,000–$58,300, with $52,000 as the next structural floor. Resistance is at $61,200–$62,500, then $64,000.

    Why is Bitcoin falling in June 2026? Spot Bitcoin ETFs have recorded over $4 billion in outflows this month, the largest monthly redemption since launch. Hawkish Fed expectations, US-Iran geopolitical uncertainty, and capital rotation into AI equities have compressed sentiment.

    Which coins are losing the most today? Dogecoin leads declines at -2.41%, followed by BNB at -1.29% and Solana at -0.42%. TRON is the top-ten gainer at +0.75%.

    What should crypto investors watch this week? Track daily spot Bitcoin ETF flow data, geopolitical developments in the US-Iran standoff, and Bitcoin’s ability to hold $58,000. The $59,000–$60,000 zone is the session’s most critical price band.

  • Bitcoin Drops to $60,000: Heavy Selling Pressure Grips Crypto Market

    Bitcoin Drops to $60,000: Heavy Selling Pressure Grips Crypto Market

    Bitcoin has entered a difficult phase after a strong rally in 2025. At the end of last year, Bitcoin touched a record high of $126,000, which created huge excitement across the crypto market. However, the current situation has sharply changed.

    As of 29 June 2026, Bitcoin trades near $59,500 to $60,500. This shows a major fall compared to previous highs. Since the start of 2026, Bitcoin has already lost more than 30% of its value. The market now faces fear and uncertainty as investors closely watch the next possible move.

    The sharp fall has created an important question in the market. Many traders now wonder whether Bitcoin has reached its lowest point for now or whether prices may fall even further in the coming weeks.

    Recent Performance Shows Weak Market Sentiment

    The first half of 2026 has been difficult for Bitcoin. During June, sellers gained strong control and pushed prices lower. Bitcoin recently fell under the important $60,000 price level, even touching nearly $59,501 during recent trading sessions.

    This price level has become important because investors usually see round numbers like $60,000 as major support zones. Once price falls below such levels, market confidence often becomes weak.

    Only one month ago, Bitcoin traded close to $81,500. The move from $81,500 to below $60,000 means Bitcoin has lost more than 22% in just one month. Compared with mid-2025, Bitcoin now trades almost 40% lower, which clearly shows how much market sentiment has changed.

    Technical Charts Show Important Warning Signs

    Technical analysis currently shows mixed signals. Bitcoin is now near an important support area between $58,000 and $60,000. This zone will likely decide the next short-term direction.

    The Relative Strength Index (RSI) is in neutral territory. This usually means neither buyers nor sellers fully control the market. At the same time, the MACD indicator recently showed bearish divergence, which often signals weaker price strength.

    The 200-day moving average, however, still points upward. This suggests that although short-term pressure is strong, the long-term market structure has not fully broken yet.

    If Bitcoin fails to move back above $60,000 soon, analysts expect another fall toward $55,000. Some experts even believe price may test $46,000 if selling pressure increases further.

    Institutional Investors Pull Money Out

    One major reason behind Bitcoin’s weakness comes from large investors pulling money out of the market. Reports show around $4.5 billion left spot Bitcoin ETFs in recent months.

    Spot Bitcoin ETFs had earlier helped bring major institutional money into crypto markets. But recent outflows show that large investors have become cautious.

    Higher global interest rates have also hurt Bitcoin demand. Many investors now prefer safer assets such as gold and traditional investments instead of risky digital assets.

    Another concern comes from Bitcoin mining companies. Current mining costs have increased sharply, and several miners now spend more money producing Bitcoin than current market prices allow. This creates extra selling pressure because miners often sell holdings to cover losses.

    Regulation Problems Continue to Create Uncertainty

    Government regulation is another major issue for the crypto market. In the United States, delays around the proposed US Clarity Act have created fresh uncertainty.

    This law aims to create clear rules for cryptocurrency markets. Without proper regulations, many institutions are hesitant about increasing crypto investments.

    Large financial firms such as Morgan Stanley and Charles Schwab have expanded crypto services during 2026. Even with this progress, unclear regulations continue to slow overall market confidence.

    Future Outlook

    Despite short-term weakness, many analysts still believe Bitcoin has strong long-term potential. Forecasts from Binance suggest Bitcoin could recover toward $68,000 to $105,000 during the second half of 2026 if market conditions improve.

    Research from Bitcoin Suisse presents an even stronger forecast. According to this report, Bitcoin may reach nearly $180,000 during the next major bull cycle, with increasing institutional adoption and stronger market liquidity.

    At the same time, bearish analysts are cautious. They believe weak economic conditions and poor investor confidence may delay any major recovery until late 2026.

    Final Thoughts

    Bitcoin currently stands at one of its most important price zones this year. After a steep fall from $126,000 to nearly $60,000, market confidence has weakened sharply.

    A move above $65,000 could help restore bullish momentum and bring fresh buying interest. On the other hand, failure to defend current levels may push Bitcoin toward $55,000 or even lower.

    Even though short-term pressure is strong, Bitcoin still holds its position as one of the most closely watched financial assets in the world. The second half of 2026 will likely decide whether the market begins recovery or faces another major correction.

    FAQs

    1. Why has Bitcoin price fallen in 2026?
    Large investor outflows, weak market sentiment, and global economic pressure have pushed prices lower.

    2. What is Bitcoin’s current price level?
    As of 29 June 2026, Bitcoin trades near $59,500 to $60,500.

    3. Why is $60,000 an important level for Bitcoin?
    This price zone acts as major support, and a breakdown could trigger further decline.

    4. Can Bitcoin recover this year?
    Some analysts expect recovery toward $68,000 to $105,000 if market conditions improve.

    5. What is the long-term Bitcoin forecast?
    Certain market reports suggest Bitcoin may reach $180,000 during the next major bull cycle.

    Disclaimer: This article is provided for informational purposes and does not constitute investment advice. You are responsible for conducting your own research before making any investments.

  • MEXC Launches TradFi Gala: $1,000,000 USDT Prize Pool for Futures Traders

    MEXC Launches TradFi Gala: $1,000,000 USDT Prize Pool for Futures Traders

    Victoria, Seychelles, June 29, 2026 – MEXC, a leading 0-fee digital asset trading platform, has announced the launch of the TradFi Gala, a month-long Futures trading campaign running from June 26 to July 26, 2026 (UTC). With rising demand for AI infrastructure and high-bandwidth memory (HBM), trading activity in AI-related stocks has surged. MEXC’s May data showed Stock Futures volume up 105% month-over-month and MU (Micron) Futures volume skyrocketing 1,002%. The campaign combines zero-fee trading, exclusive new user rewards, and competitive events, offering a total reward pool of 1,000,000 USDT.

    TradFi Gala: Four Reward Opportunities for Traders

    The TradFi Gala features four events targeting both new and existing users:

    • 0-Fee Trading Fest: Zero trading fees on selected Futures pairs including MUUSDT, SKHYNIXUSDT, INTCUSDT, SNDKUSDT, and more.
    • Welcome Power Reward: New users who deposit at least $100 and hold it for 24 hours receive a $200 position airdrop and one chance to pull the Treasure Lever.
    • Treasure Lever Frenzy: Users earn pulls by completing trading tasks, competing for a share of 300,000 USDT, including a $20,000 SKHYNIX position airdrop grand prize.
    • TradFi Trading Rush: Three-tiered challenges distribute 650,000 USDT in Futures bonuses, with separate pools for new users and all participants based on trading volume.

    As AI and semiconductor stocks attract growing investor interest, MEXC continues to expand its TradFi product suite. Users can trade U.S. stocks like Intel, Micron, and SanDisk directly within a single account, benefiting from competitive fees, deep liquidity, and fast execution. The TradFi Gala reinforces MEXC’s commitment to “0 Fees” and “Infinite Opportunities.”

    For more details and to participate, visit the MEXC TradFi Gala page.

    About MEXC

    MEXC is the world’s fastest-growing cryptocurrency exchange, trusted by over 40 million users across 170+ markets. It offers industry-leading 0-fee trading and access to over 3,000 digital assets, along with tokenized stocks, ETFs, commodities, and precious metals.

    Risk Disclaimer: This content does not constitute investment advice. Cryptocurrency markets are highly volatile; investors should assess risks carefully before trading.

  • Solana (SOL) Bounces Off $60 Support: Oversold Signals and ETF Hopes Fuel Breakout Prospects

    Solana (SOL) Bounces Off $60 Support: Oversold Signals and ETF Hopes Fuel Breakout Prospects

    Solana’s native token, SOL, has staged a notable recovery after dipping near the critical $60 support level during a broad market correction. Strong buying pressure at this zone halted further declines, reigniting trader confidence and speculation about a potential breakout.

    At press time, SOL is trading around $66–$68, having touched lows close to $61 during the recent sell-off driven by Bitcoin’s brief drop near $60,000. Despite the broader weakness, Solana held one of its strongest support levels, signaling resilient demand.

    Technical Indicators Point to Oversold Reversal

    The Relative Strength Index (RSI) recently entered oversold territory, a historical precursor to short-term rebounds for SOL. Past data shows that similar oversold readings often preceded swift recoveries, and the bounce from $60 reinforces this pattern. Analysts now watch whether this rebound matures into a sustained uptrend or fades as a dead cat bounce.

    Correction Erased Earlier Gains, but Network Fundamentals Remain Strong

    Earlier this year, SOL traded above $90 before losing nearly 25% due to weak market sentiment, global economic uncertainty, and Bitcoin’s decline. However, the defense of $60 demonstrated strong buying interest at lower levels. Meanwhile, Solana’s blockchain continues to thrive: the network processed 25.3 billion transactions in Q1 2026, active addresses are near record highs, and stablecoin usage is rising. This divergence between price weakness and on-chain strength underpins long-term optimism.

    ETF Speculation and Rising Volume Lift Sentiment

    Renewed discussions around a potential spot Solana ETF have improved market sentiment. Although no official approval has been granted, the prospect of institutional inflows keeps traders hopeful. Additionally, 24-hour trading volume has surged past $3.8 billion, indicating renewed participation after panic selling subsided.

    Key Resistance at $70 in Focus

    Traders now eye the $70 resistance level. A decisive break above could trigger buying toward the $78–$80 range, where SOL traded before the correction. Failure to clear $70 might lead to a retest of $60. The coming sessions will be critical in determining the token’s short-term direction.

    Network Upgrade and Long-Term Outlook

    Solana’s development team continues advancing the Alpenglow upgrade, which aims to reduce transaction finality to ~150 milliseconds and boost validator performance. This technical improvement could strengthen Solana’s position in DeFi, gaming, and asset tokenization, adding to the positive long-term narrative.

    For now, SOL stands at a crossroads. Oversold signals, robust network activity, rising volume, and ETF hopes have revived breakout hopes, but the market awaits confirmation above $70 to validate a sustained recovery.

  • Best Crypto Exchanges for High-Net-Worth Traders in 2026: Security, Liquidity, and OTC Desks Compared

    Best Crypto Exchanges for High-Net-Worth Traders in 2026: Security, Liquidity, and OTC Desks Compared

    High-net-worth crypto traders require platforms that offer robust security, deep liquidity, low fees, and advanced trading tools. In 2026, Binance, Coinbase, Kraken, OKX, and Crypto.com emerge as the top choices for wealthy investors. This article evaluates each exchange based on key criteria such as liquidity, security, regulatory compliance, and specialized services like over-the-counter (OTC) desks.

    Key Considerations for Wealthy Crypto Investors

    • Deep Liquidity: Essential for executing large transactions without significant price slippage.
    • Security and Compliance: Critical for protecting substantial portfolios and meeting regulatory standards.
    • Advanced Products: Exchanges now offer ETFs, futures, staking, and tokenized assets to cater to sophisticated investors.

    Binance: Dominant Liquidity and Expanding Services

    Binance remains the largest crypto exchange by trading volume, handling billions of dollars daily. Its deep liquidity allows high-net-worth traders to execute large orders with minimal market impact. The platform also features a robust OTC desk for private transactions and offers advanced futures products with reduced fees for VIP clients. In June 2026, Binance expanded beyond crypto by introducing direct access to U.S. stocks and ETFs, positioning itself as a competitor to traditional financial platforms.

    Coinbase: Trust Through Regulation

    Coinbase prioritizes regulatory compliance, making it a safe choice for investors seeking transparency and long-term security. Its premium service, Coinbase Prime, provides institutional clients with secure custody, advanced tools, and dedicated support. In June 2026, Coinbase restored Indian rupee support, enabling direct deposits and withdrawals, and launched index-based perpetual futures tied to AI, defense, and Nasdaq-linked sectors, broadening opportunities for advanced traders.

    Kraken: Unmatched Security

    Kraken is renowned for its strong security record, appealing to high-net-worth investors concerned about cyber threats. The exchange offers professional-grade trading infrastructure with rapid execution, deep spot liquidity, futures markets, and reliable API support. Its private OTC desk facilitates large trades without affecting public order books. Independent analysts consistently rank Kraken among the most secure platforms, with transparent reserve accounting and controlled asset management.

    OKX: Innovation for Institutional Clients

    OKX has rapidly grown into a leading exchange for wealthy traders, focusing on derivatives, automated trading, and structured products. A major milestone was its partnership with Intercontinental Exchange (owner of the NYSE) to form OKXICE, a joint venture targeting tokenized securities and blockchain-based financial products. This move bridges crypto and traditional finance, positioning OKX as a strong long-term platform.

    Crypto.com: Expanding Beyond Retail

    Originally popular with retail users, Crypto.com now attracts larger investors with over 450 supported cryptocurrencies, lending services, staking rewards, and asset management tools. In 2026, it ranks among the top platforms for crypto staking, offering both capital growth and passive income. Its growing institutional infrastructure signals a shift beyond small retail traders.

    What Wealthy Traders Should Focus On

    Large investors need more than basic trading access. Liquidity is paramount to avoid price slippage on million-dollar orders. Private OTC desks enable discreet execution of large transactions. Security measures like cold storage, insured custody, and reserve transparency reduce risk. Regulatory compliance is increasingly important as global regulations tighten. Additionally, exchanges are expanding into stocks, ETFs, tokenized securities, and lending services, creating integrated ecosystems.

    Final Outlook

    The crypto exchange industry now demands institutional-grade infrastructure for wealthy investors. Binance leads in liquidity and volume, Coinbase in trust and regulation, Kraken in security, OKX in innovation, and Crypto.com in diversification and passive income. As institutional money flows into digital assets, choosing the right exchange becomes a critical decision for serious investors.

    Frequently Asked Questions

    1. Which crypto exchange is best for high-net-worth traders? Binance offers the best combination of high liquidity, low fees, and advanced tools.
    2. Why do wealthy traders prefer OTC trading? OTC trading allows large transactions without affecting public market prices.
    3. Is Coinbase safe for large investments? Yes, due to strong regulatory compliance and secure custody systems.
    4. Which exchange offers the best security in 2026? Kraken is consistently ranked among the safest for its reserve transparency and security systems.
    5. What matters most when choosing a crypto exchange? Liquidity, security, legal compliance, custody protection, and advanced trading products are key factors.
  • Bitcoin Network Activity Hits Record Highs Despite Flat Price Action

    Bitcoin Network Activity Hits Record Highs Despite Flat Price Action

    Bitcoin prices have remained stagnant for several months, but on-chain data reveals a sharp surge in network activity. This unusual divergence suggests Bitcoin is evolving beyond speculative trading into a utility-driven digital asset.

    Key Takeaways

    • Bitcoin network activity is near record highs despite stagnant market prices.
    • Lightning Network adoption and small transactions show growing real-world utility.
    • Strong miner investment and institutional demand indicate long-term confidence in Bitcoin.

    Recent blockchain data shows the Bitcoin network handled nearly 678,000 transactions in the last 24 hours—one of the highest daily figures this year. Approximately 104,500 BTC moved across the network daily, representing billions of dollars in value. Yet the price has not experienced major growth, creating a gap that has caught analysts’ attention.

    Small Transactions Drive Higher Activity

    According to CryptoQuant, Bitcoin network activity has approached record levels in 2026. Unlike previous market cycles dominated by speculative traders, today’s activity comes from regular wallet transfers, small payments, and new blockchain experiments. This shift reflects broader adoption and stronger real-world use.

    Lightning Network Expansion Supports Growth

    The Lightning Network now supports over 17,000 public nodes, nearly 40,000 payment channels, and about 4,900 BTC in capacity. This layer-2 solution enables near-instant, low-fee transactions, encouraging businesses to adopt Bitcoin payments. As more companies integrate Bitcoin, overall network usage rises even during calm market periods.

    Miners Continue Heavy Investment

    Bitcoin’s hashrate recently reached nearly 894 exahashes per second (EH/s)—close to a record. This indicates miners are investing heavily in hardware and infrastructure, signaling strong belief in Bitcoin’s future despite short-term price weakness.

    Institutions Help Keep Market Stable

    Large financial institutions are playing a larger role. VanEck’s May 2026 report showed Bitcoin gained nearly 11.8% in one month, but futures market activity remained lower than in previous bull runs. This suggests healthier demand from real buyers rather than leveraged speculators.

    Existing Users Become More Active

    Daily active Bitcoin addresses recently touched approximately 644,600 per day. However, new user growth is slower compared to past bull markets. This indicates that existing holders are using Bitcoin more frequently for regular transactions, reinforcing the network’s utility.

    Mining Industry Builds for the Future

    Several major mining companies are expanding into AI and high-performance computing while continuing Bitcoin mining. Despite reduced profits after the halving, infrastructure spending remains high, keeping network security near historic levels.

    Bigger Economic Factors Affect Price

    Bitcoin prices now depend on ETF demand, interest rate decisions, market liquidity, and institutional investment cycles. Network growth alone no longer guarantees immediate price increases, creating a temporary disconnect between strong fundamentals and market value.

    Strong Foundation Builds for Future Growth

    Rising transaction volume, rapid Lightning Network growth, record mining power, and higher user activity all point toward stronger adoption. History shows that strong growth in Bitcoin fundamentals often precedes major market moves. In 2026, this surge in network usage is one of the clearest signs that Bitcoin adoption continues to expand even when prices remain stagnant.

    FAQs

    1. Why is Bitcoin network activity rising while the market price stays flat? Users are shifting from speculative trading to real-world utility. Routine wallet transfers and small digital payments drive high transaction volumes without causing speculative price spikes.
    2. What role does the Lightning Network play? This layer-2 system enables near-instant, low-fee transactions. Expanding nodes and channels allow global businesses to process daily micro-payments efficiently.
    3. Why are miners expanding infrastructure despite weak price action? Miners prioritize long-term blockchain value. The near-record hashrate confirms heavy capital investment in new hardware, signaling institutional confidence.
    4. Are financial institutions changing how Bitcoin behaves? Yes. Capital is shifting toward direct spot buying rather than high-risk leveraged futures trading, creating a stable price floor during macroeconomic uncertainty.
    5. Does higher blockchain usage guarantee an immediate price surge? No. Bitcoin now responds to macroeconomic pressures like central bank interest rates and institutional ETF inflows, decoupling raw network utility from immediate price action.

    Disclaimer: This article is for informational purposes only and does not constitute investment advice. Always conduct your own research before making any financial decisions.

  • XRP Shows Early Recovery Signs After June Drop as Bullish Patterns and ETF Inflows Emerge

    XRP Shows Early Recovery Signs After June Drop as Bullish Patterns and ETF Inflows Emerge

    XRP is flashing early recovery signals after plummeting more than 20% in June. The token briefly dipped near $1.01 amid a broader crypto sell-off that pushed traders into safer positions. Despite marking its weakest monthly performance since February 2025, several technical indicators, consistent exchange-traded fund (ETF) inflows, and a historically strong July performance are giving traders reason to watch closely. However, analysts caution that the setup ”does not confirm a full reversal” as XRP trades near key support levels.

    Technical Indicators Suggest Selling Pressure Is Easing

    Crypto analyst Ali Martinez reported that the Tom DeMark Sequential indicator has flashed a buy signal on XRP’s daily chart. This tool is used to identify when a trend may be nearing exhaustion after a sustained move in one direction. According to Martinez, similar signals on XRP have occasionally preceded rebounds lasting between one and four daily candles. However, the indicator only points to a possible short-term recovery—it does not confirm a lasting bottom.

    XRP has also formed a Morning Star Doji pattern across three daily candles, a classic reversal pattern that appears after a steep decline when selling pressure weakens and buyers begin to step in. Martinez noted that the combination of these two signals suggests sellers ”may be losing control,” but further confirmation is still required.

    For a recovery to gain traction, XRP needs stronger trading volume and a move above nearby resistance. The first barrier sits near $1.10. A confirmed break above that level could open the door to $1.15 and then $1.20.

    XRP ETF Inflows Top $15 Million as Total Assets Reach $934 Million

    US-listed spot XRP ETFs recorded $15.63 million in daily net inflows on June 26, according to SoSoValue data. Total net assets across the funds reached $934.26 million while XRP traded near $1.05. Bitwise led with $11.66 million in inflows, followed by Franklin’s XRPZ fund at $3.97 million. Products from Canary, 21Shares, and Grayscale reported no daily net inflows.

    Bitwise also held the largest share of XRP ETF assets, with $293.49 million, while Franklin’s XRPZ held $235.20 million and Canary’s fund held $234.97 million. The inflows indicate that some investment demand remained active despite the June decline, though ETF activity alone cannot determine XRP’s next price move. Traders are also watching broader market conditions, Bitcoin’s direction, and liquidity.

    Bulls Defend $1.05 as July History Offers Cautious Optimism

    XRP traded near $1.06 on the four-hour chart, with buyers defending the $1.05 area. The broader $1.00 level also held as a key support during the latest decline. A move above $1.10 could support a recovery toward $1.15, and additional buying might then target $1.20. Martinez identified $1.30 as a larger goal, though XRP previously faced strong selling near that price.

    Downside risks persist. XRP must hold support near $1.06 to avoid another test of $1.00. Martinez warned that a clear breakdown could expose lower realized-price zones near $0.80, $0.62, and $0.51.

    Meanwhile, XRP has recorded positive returns in July for each of the past six years, most with double-digit gains, including strong advances in 2020 and 2023. Still, analysts caution that ”past July gains do not guarantee another rally,” especially while market sentiment remains weak.