Category: Finance

  • Kusumgar IPO Allotment Status Released: How to Check and Expected 38% Listing Gain

    Kusumgar IPO Allotment Status Released: How to Check and Expected 38% Listing Gain

    The Kusumgar IPO allotment status was announced on July 13, 2026, following an overwhelmingly positive response from investors. The public issue saw a massive subscription of 128.85 times, with Qualified Institutional Buyers leading demand, followed by Non-Institutional Investors and retail participants. As a result, many applicants saw their chances of securing shares reduced due to the high oversubscription.

    How to Check Your IPO Allotment Status

    Investors can verify their allotment status on the official websites of BSE, NSE, or the registrar, Bigshare Services. The process is straightforward:

    • On NSE: Select the IPO, enter your application number or PAN, and submit.
    • On BSE: Choose the equity issue, select Kusumgar Limited, enter your application number or PAN, complete the captcha, and submit.
    • On Bigshare Services: Use the same details (PAN, application number, or DP/Client ID) to check the result.

    Shares allotted to successful applicants will be credited to their Demat accounts on July 14. Unsuccessful bidders will have their blocked funds released on the same day. The company is scheduled to make its stock market debut on July 15 on both the NSE and BSE.

    Kusumgar IPO GMP and Listing Expectations

    The strong subscription reflects high investor confidence. The grey market premium (GMP) for the Kusumgar IPO stands at Rs. 160 as of July 13. Based on the upper issue price of Rs. 419 per share, the estimated listing price is around Rs. 579, implying a potential listing gain of approximately 38% if market conditions remain favorable. However, GMP is an unofficial indicator and can change rapidly, so the final listing price may differ.

    Company Profile and IPO Details

    Founded in 1990, Kusumgar manufactures engineered synthetic fabrics for industries including aerospace, defense, automotive, industrial equipment, and outdoor products. The company operates seven manufacturing units across Gujarat and Uttar Pradesh. The Rs. 650 crore IPO was entirely an Offer for Sale, meaning existing shareholders sold their shares, and the company will not receive any fresh funds from the issue.


  • US Stock Futures Decline as Middle East Tensions Drive Oil Prices Higher, Stoking Market Anxiety

    US Stock Futures Decline as Middle East Tensions Drive Oil Prices Higher, Stoking Market Anxiety

    US stock futures edged lower on Monday as renewed tensions in the Middle East unsettled investors and sent crude oil prices higher, raising concerns over inflation and global economic growth.

    Nasdaq futures suffered the biggest loss, with S&P 500 and Dow Jones Industrial Average futures indicating the market will open lower as investors weighed the impact of rising energy prices amid uncertainty over the interest rate outlook.

    Oil Rise Puts Pressure on Market Sentiment

    Oil prices increased amid growing tensions between the United States and Iran. Concerns about potential oil supply disruptions have arisen due to the strategically located Strait of Hormuz, which is among the most active oil transportation routes worldwide.

    Brent crude oil has been hovering near $79 per barrel, while West Texas Intermediate has exceeded $74 per barrel. Increased oil prices have caused inflation concerns.

    Tech and semiconductor stocks continued to underperform as investors cut positions in growth sectors. Increasing bond rates have contributed to weakness in tech stocks due to their sensitivity to rate changes.

    Attention Turns to Earnings and Inflation Reports

    Despite geopolitical and market uncertainties, investors are preparing for yet another busy week on Wall Street. Several big US banks are expected to report earnings next week, kicking off the earnings season. Market participants will watch how tech firms perform during earnings in the upcoming days.

    Moreover, investors will consider figures on US inflation and statements by Fed Chair Kevin Warsh, which may have a strong impact on market expectations for further Fed action. Any indications of inflation persistence, especially following the oil price hike, may add to the list of reasons to maintain high interest rates.

    For now, investors are trying to weigh geopolitical influences against company earnings and economic data. It seems that all these issues will play an important role in global markets in the coming days.

  • Top Stock and Crypto Portfolio Tracker Apps for 2026: Expert Picks and Trends

    Top Stock and Crypto Portfolio Tracker Apps for 2026: Expert Picks and Trends

    Managing a diverse investment portfolio that includes stocks, ETFs, mutual funds, and cryptocurrencies can be a challenge. Portfolio tracker apps have evolved far beyond simple price updates, now offering detailed reports, market news, performance charts, dividend records, tax information, and even AI-powered insights. Here are the best options for 2026.

    Delta Investment Tracker: Best Overall Choice

    Delta remains a top-tier portfolio tracker, supporting stocks, ETFs, cryptocurrencies, and more. It integrates seamlessly with hundreds of brokers and crypto exchanges, simplifying portfolio management. Features include detailed performance reports, dividend tracking, price alerts, and multi-currency support. While some advanced features require the Pro version, the free version offers substantial utility. Delta is ideal for investors holding both stocks and crypto.

    Kubera: Complete Wealth Tracking

    Kubera is popular among high-net-worth individuals for its comprehensive tracking across stocks, crypto, real estate, private investments, bank accounts, and NFTs. It provides a single-dashboard view of net worth and supports estate planning and family wealth management. Its premium subscription is best suited for serious investors rather than beginners.

    Yahoo Finance: Strong Free Option

    Yahoo Finance remains a reliable free choice for stock-focused investors. It combines portfolio tracking with market news, earnings calendars, analyst ratings, and watchlists. Crypto features are more limited but adequate for general market awareness.

    CoinStats: Leading Crypto Tracker

    CoinStats excels in cryptocurrency tracking, supporting over 300 exchanges and wallets. It includes features for DeFi and NFT monitoring, price alerts, detailed portfolio reports, tax management, and wallet linking. Its expanding blockchain compatibility makes it a top pick for crypto investors.

    Sharesight and Stock Events: Specialized Tools

    Sharesight focuses on long-term stock investors, tracking total returns, dividends, capital gains, tax reports, and benchmark comparisons. Stock Events is tailored for dividend investors, providing clear calendars, income forecasts, and payment schedules.

    Empower and Morningstar: Additional Value

    Empower (formerly Personal Capital) is ideal for retirement planning with strong stock tracking and financial planning tools, though crypto support is limited. Morningstar Portfolio Manager offers detailed company analysis and research for traditional stock investors.

    Key Trends in 2026

    AI is transforming portfolio analysis, with platforms using machine learning to study asset allocation, measure risk, and offer personalized insights. Unified asset tracking allows investors to see stocks, crypto, cash, and alternative assets on a single dashboard. Tax automation has become common, with apps generating capital gains reports and tax-loss harvesting summaries. Crypto trackers continue to expand support for new wallets, blockchain networks, and DeFi platforms.

    Choosing the Right Tracker

    The best app depends on your goals: Delta for balanced stock/crypto tracking, Kubera for comprehensive wealth management, CoinStats for crypto, Sharesight for detailed stock performance, Yahoo Finance for a free solution, and Stock Events for dividend focus. As portfolios become more diverse, a good tracker saves time, enhances financial organization, and provides a clearer view of investment performance.

    FAQs

    Which app is best for both stocks and crypto?

    Delta is widely regarded as the best all-round portfolio tracker for its strong support of both asset classes.

    Which app is best for crypto investors?

    CoinStats is a top choice for its extensive exchange and wallet support, including DeFi and NFTs.

    Is there a good free portfolio tracker?

    Yahoo Finance offers a reliable free option with portfolio tracking, market news, and watchlists.

    Which app is best for dividend investors?

    Stock Events is popular for its dividend calendars and income forecasts.

    What is the biggest trend in portfolio trackers in 2026?

    AI-driven analysis, unified asset tracking, and automated tax reporting are the major developments.

  • GIFT Nifty Signals Weak Start as Middle East Tensions Push Crude Higher: Sensex, Nifty Outlook

    GIFT Nifty Signals Weak Start as Middle East Tensions Push Crude Higher: Sensex, Nifty Outlook

    The Indian stock market is expected to open lower on Monday as escalating US-Iran tensions and uncertainty over the Strait of Hormuz drive crude oil prices higher, renewing inflation concerns. GIFT Nifty is trading at 24,025, a discount of 198 points from its previous Nifty futures close, indicating a gap-down start.

    Market Recap: Friday’s Gains

    On Friday, the Sensex gained 827.57 points (1.08%) to close at 77,569.39, while the Nifty 50 advanced 244.10 points (1.02%) to finish at 24,206.90. Broader markets outperformed, with the Nifty Midcap 100 rising 1.4% and the Nifty Smallcap 100 advancing 1.5%. Foreign institutional investors (FIIs) bought shares worth Rs 2,603.72 crore, and domestic institutional investors (DIIs) added Rs 2,019.68 crore.

    Sensex Outlook

    Technically, the Sensex closed above 77,500, extending its recovery and maintaining a constructive structure. The market found support near 76,100 and bounced sharply. Short-term texture remains volatile and non-directional.

    Amol Athawale, VP of Technical Research at Kotak Securities, said: “An uptrend may continue. On the higher side, the market could move up to 78,000–78,300. Upside may continue, potentially lifting the market to 78,700. On the flip side, if the market falls below 77,000, it could retest 76,100. Below 76,100, the chances of hitting 75,600–75,500 would increase.”

    Nifty 50 Outlook

    Nifty 50 remains in a broader consolidation phase while maintaining an upward bias. The index formed a high-wave candle on the weekly chart, reflecting volatility but indicating buyers defend lower levels.

    Bajaj Broking Research noted: “Broader market to extend outperformance with Nifty midcap 100 already at an all-time high. We expect Nifty small cap index also to rally to a fresh all-time high. The Index has immediate support at 23,800 levels, being almost identical lows of the last 4 weeks.”

    Near-term range is 23,800–24,350. A sustained move above 24,350 could push the index toward 24,600 and then 24,800. If geopolitical tensions intensify and the index falls below 23,800, selling pressure could drag it to 23,600–23,400.

    Bank Nifty Outlook

    Bank Nifty rose 793.45 points (1.39%) to close at 58,045.90 on Friday. It formed a Dragonfly Doji on the weekly chart, indicating strong buying interest at lower levels. The index is expected to consolidate in the 56,500–58,700 range near term.

    Bajaj Broking added: “A weakness below Wednesday’s low of 56,550 will open downside toward 55,500–55,000. On the higher side, only a move above 58,700 will signal resumption of the up-move toward 59,200 and 60,000 in the coming weeks.”

    Disclaimer: Analytics Insight does not provide financial advice or guidance. This article is for informational purposes only. Readers should conduct their own research before investing.

  • MCX Gold Drops 1% to Rs 1,42,050 as Middle East Tensions Boost Brent Crude 4%

    MCX Gold Drops 1% to Rs 1,42,050 as Middle East Tensions Boost Brent Crude 4%

    Gold prices on the Multi Commodity Exchange (MCX) fell 1% on July 13, with August futures settling at Rs 1,42,050 per 10 grams. The decline came as escalating tensions between the US and Iran drove crude oil prices higher and strengthened the US dollar, creating headwinds for the precious metal.

    September silver futures also declined, dropping 1.9% to Rs 2,18,439. Meanwhile, Brent crude futures surged 4.05% to $79.09 per barrel, and US West Texas Intermediate (WTI) advanced 4.13% to $74.36 per barrel.

    According to the CME FedWatch Tool, traders now price in a 72% chance of a Federal Reserve rate hike in September, up from 63% last week.

    Domestic Gold Prices

    In the Indian bullion market, 24K gold fell by Rs 142 to Rs 1,42,910 per 10 grams, while 22K gold declined by Rs 130 to Rs 1,31,000. City-wise, Mumbai and Kolkata quoted gold at Rs 1,42,910, Delhi at Rs 1,43,050, and Chennai at Rs 1,44,000.

    US Gold Prices

    US gold prices also declined over 1% on Monday amid concerns over the potential closure of the Strait of Hormuz, which pushed oil prices higher and revived expectations of elevated interest rates. Spot gold dropped 1.5% to $4,059.11 per ounce, and US gold futures for August delivery were down 1.1% at $4,067.10.

    Spot silver declined 2.9% to $58.14 per ounce, platinum shed 1.8% to $1,598.48, and palladium fell 2.3% to $1,247.27.

    Key Levels to Watch

    “Any breakout of violence in the Gulf is accompanied by pressure on gold,” said Nicholas Frappell, global head of institutional markets at ABC Refinery. “The question is, if the Strait of Hormuz remains effectively or partially closed, does that lead to a deflationary effect, further down the road, that might actually be supportive for gold if you have demand destruction leading to lower economic activity,” Frappell added.

    Internationally, gold has support at $4,074 and $4,040, while resistance is at $4,144 and $4,180 per troy ounce. Silver has support at $59.10 and $57.70, with resistance at $61.20 and $62.40 per troy ounce.

    On MCX, gold has support at Rs 1,42,400 and Rs 1,41,100, and resistance at Rs 1,44,400 and Rs 1,45,550. Silver has support at Rs 2,20,000 and Rs 2,16,600, and resistance at Rs 2,26,000 and Rs 2,28,800.

  • Indian Stock Market Slides as Rising Oil Prices Weigh on Sentiment; Nifty50 Hits 24,124, Sensex at 77,279

    Indian Stock Market Slides as Rising Oil Prices Weigh on Sentiment; Nifty50 Hits 24,124, Sensex at 77,279

    The Indian stock market experienced a cautious trading session on July 13, with both benchmark indices declining as escalating US-Iran tensions pushed crude oil prices higher. The Nifty50 slipped 8.95 points (0.34%) to 24,124.95, while the Sensex dropped 290 points (0.37%) to 77,279.48. Investor sentiment turned risk-averse, with selling pressure spanning multiple sectors.

    Key Takeaways

    • Nifty50 and Sensex trade lower as crude oil prices rise on renewed US-Iran tension.
    • Metal, financial, auto, and banking stocks underperform, while IT and pharma show relative strength.
    • Laser Power & Infra, Devson Catalyst, and Happy Steels IPOs enter their final day of subscription.

    Rising Oil Prices Weigh on Market Mood

    The latest surge in crude oil prices stems from renewed geopolitical tension between the United States and Iran, raising fears of potential supply disruptions. As India is a major importer of crude oil, higher prices typically increase transportation, manufacturing, and production costs, fueling inflationary pressures and potentially squeezing corporate earnings. This has prompted investors to reduce exposure to sectors sensitive to rising operational expenses.

    Heavyweight Stocks Drag Indices Lower

    Major stocks such as InterGlobe Aviation, Tata Steel, and Maruti Suzuki India were the top losers in the Nifty50. InterGlobe Aviation faced headwinds from higher fuel costs, while Tata Steel suffered from broad selling in the metal sector. Maruti Suzuki India declined amid concerns over rising input costs affecting the automobile industry.

    Broader Market Also Under Pressure

    The weakness extended beyond large-cap stocks. The Nifty MidCap fell 0.29%, and the Nifty SmallCap slipped 0.13%, indicating that selling pressure was widespread across market segments.

    Sectoral Performance: Metal Stocks Hit Hardest

    The Nifty Metal index posted the worst performance, driven by global economic uncertainties. Nifty Financial Services and Nifty Auto also remained under strain, with the latter particularly impacted by rising crude prices affecting production costs and consumer demand. The Nifty Bank index faced similar selling pressure.

    In contrast, Nifty IT and Nifty Pharma outperformed. Investors typically pivot to defensive sectors like IT and pharma during periods of uncertainty, as their earnings are less sensitive to commodity price fluctuations.

    IPO Market Remains Active

    Despite the volatile market, the primary market is buzzing. The Laser Power & Infra IPO, aiming to raise Rs. 742 crore, enters its final subscription day. Devson Catalyst (Rs. 42.32 crore) and Happy Steels (Rs. 25 crore) IPOs also conclude their subscription period today, attracting investor interest.

    Market Outlook

    The Indian stock market is trading with a negative bias, driven by escalating US-Iran tensions and higher crude oil prices. Weakness in metal, financial, auto, and banking sectors adds to the pressure, while IT and pharma provide limited support. The broader market reflects cautious sentiment. The next direction will depend on global developments, crude oil price movements, and investor confidence.

    Frequently Asked Questions

    1. Why are crude oil prices dragging down the Indian stock market?

    India is a major oil importer. Rising crude prices increase operational costs for businesses—particularly in aviation, logistics, and manufacturing—while fueling inflationary concerns that can squeeze corporate profit margins.

    2. Which sectors are being hit hardest today?

    The Nifty Metal index is seeing the sharpest declines amid global economic jitters. The Auto, Financial Services, and Banking sectors are also under significant selling pressure.

    3. Why are IT and Pharma stocks performing relatively better?

    Investors often pivot to IT and Pharma during periods of geopolitical uncertainty. These sectors are considered ‘defensive’ since their earnings are typically less sensitive to fluctuating commodity and energy prices.

    4. What is the current status of the IPO market?

    Despite broader market volatility, the primary market remains active. The Laser Power & Infra, Devson Catalyst, and Happy Steels IPOs are all in their final day of subscription, drawing continued investor interest.

    5. How should investors navigate this period of uncertainty?

    Market participants are currently practicing caution by avoiding aggressive bets. Most are closely monitoring US-Iran developments, as any further escalation in crude prices will likely dictate whether the market finds stability or faces further downside.

  • Kalyan Jewellers Surges 47% in Four Days – Should Investors Buy, Sell, or Hold?

    Kalyan Jewellers Surges 47% in Four Days – Should Investors Buy, Sell, or Hold?

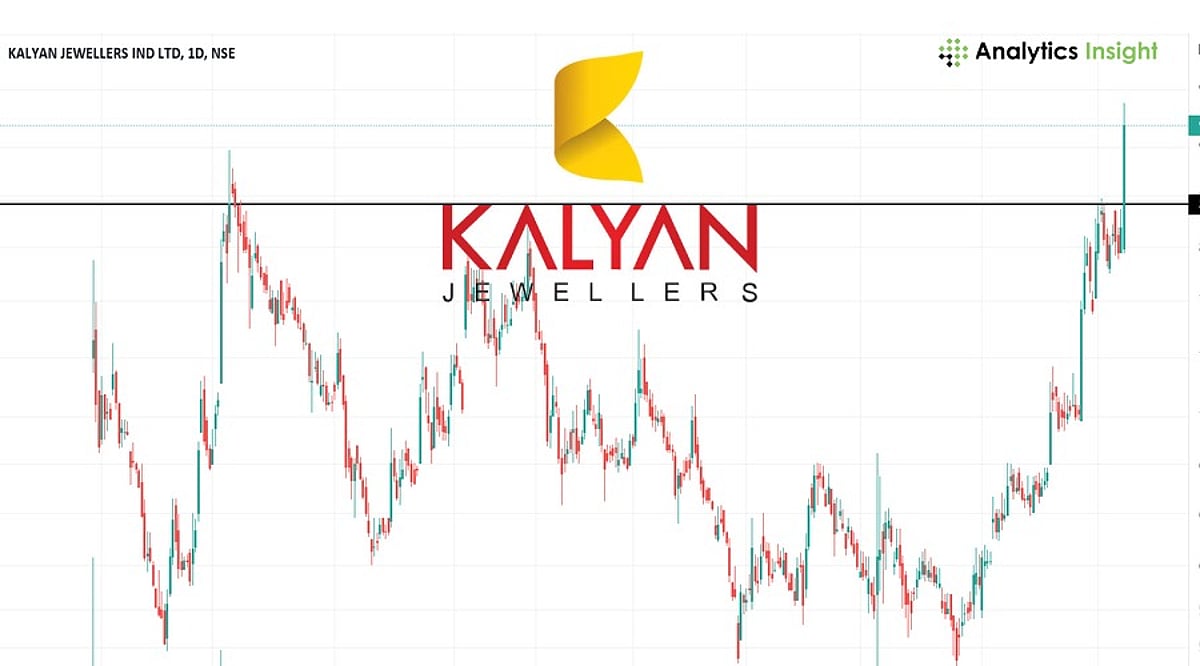
    Kalyan Jewellers closed at Rs. 524.75 on the NSE on Monday, capping a stunning four-day rally of nearly 47%. The stock touched an intraday high of Rs. 527.60, adding roughly Rs. 16,500 crore to the company’s market capitalization. The surge has made it one of the strongest performers on Dalal Street this week.

    Driven by a better-than-expected quarterly business update, robust domestic demand, and aggressive showroom expansion, investor confidence surged across the organized jewelry sector. The stock also broke above key resistance levels, attracting momentum traders and triggering short covering.

    While the rally reflects strong fundamentals, the rapid price appreciation now raises a critical question: should investors chase the stock or book profits?

    What’s Fueling the Rally?

    Several catalysts converged to propel shares higher:

    • Strong Q1 performance: Kalyan Jewellers reported impressive revenue growth despite elevated gold prices, indicating resilient demand for branded jewelry.
    • Expansion strategy: The company continues to open new showrooms, especially in high-growth regions, leveraging a franchise model to scale quickly.
    • Sector tailwinds: India’s organized jewelry market benefits from shifting consumer preferences toward hallmark jewelry, transparent pricing, and trusted brands.
    • Wedding and premiumization demand: Secular trends like wedding spending and premiumization provide a long-term growth runway.

    These structural factors go beyond short-term trading momentum, creating a compelling investment thesis.

    Valuation Concerns Emerge

    Despite the positive outlook, a 47% rise in just four sessions significantly alters the risk-reward equation. The stock now prices in not only a strong first quarter but also sustained earnings growth over several quarters. Expectations have risen sharply.

    To justify the current valuation, Kalyan Jewellers must consistently deliver revenue growth, maintain healthy margins despite gold price volatility, and execute its expansion plans effectively. Any slowdown in execution could trigger a correction.

    Should Investors Book Profits?

    The answer depends on your investment horizon:

    • Short-term traders: Booking partial profits after a near 50% run-up is logical, as sharp moves often lead to consolidation.
    • Long-term investors: Those focused on the structural growth story of India’s organized jewelry market may prefer to hold, given Kalyan Jewellers’ strong positioning. Portfolio rebalancing, rather than a full exit, can be a prudent approach.

    Peer Performance

    The rally also lifted sentiment for other listed jewelry stocks. Titan, Senco Gold, P N Gadgil Jewellers, and Thangamayil Jewellery have all gained on improved sector confidence and strong business updates.

    Market Outlook

    The recent surge reflects more than a short-term reaction – it signals growing confidence in organized jewelers that are capitalizing on formalization of the Indian jewelry market. However, given the sharp rally, the stock’s next leg will depend on the company’s ability to convert demand into earnings growth, sustain margins, and execute expansion successfully.

    FAQs

    1. Why did Kalyan Jewellers’ shares rally nearly 47%?

    The rally followed a strong Q1 business update, robust domestic demand, store expansion plans, and increased investor confidence in organized jewelry retailers.

    2. Should investors book profits after the rally?

    Short-term traders may consider partial profit booking, while long-term investors should focus on earnings growth, expansion strategy, and future business performance.

    3. How did Kalyan Jewellers perform on Monday?

    The stock rose 10.21% to close at Rs. 524.75 on the NSE, with an intraday high of Rs. 527.60.

    4. Which other jewellery stocks are gaining?

    Titan, Senco Gold, P N Gadgil Jewellers, and Thangamayil Jewellery have also gained on improving sector sentiment.

    5. What will determine Kalyan Jewellers’ future stock performance?

    Consistent revenue growth, healthy margins, successful store expansion, festive demand, and sustained investor confidence.

    Disclaimer: This article is for informational purposes only and does not constitute investment advice. Always do your own research before investing.

  • FTSE 100 Opens Lower as Middle East Tensions Drive Brent Crude Up 3.72%

    FTSE 100 Opens Lower as Middle East Tensions Drive Brent Crude Up 3.72%

    The FTSE 100 opened 10 points lower at 10,486.74 on Monday, as renewed escalation in the Middle East pushed oil prices sharply higher. Energy-heavy blue-chip stocks helped offset a broader risk-off mood across the market.

    Brent crude futures surged 3.72% to $78.90 a barrel, while US West Texas Intermediate (WTI) advanced 3.74% to $74.08 a barrel. Sterling weakened to $1.3380, down from $1.3419 at the London close on Friday, and fell against the euro to €1.1730 from €1.1737.

    Gainers and Losers

    Top Gainers:

    • Persimmon: +3.52% to £1,073.50
    • Vodafone Group: +3.13% to £113.55
    • Shell: +1.38% to £3,080.50
    • BP: +2.59% to £495.15
    • Computacenter: +1.93% to £4,540
    • BT Group: +1.55% to £193

    Notable Losers:

    • AstraZeneca: -1.26% to £12,672
    • Spirax Group: -1.53% to £6,455
    • Endeavour Mining: -1.80% to £3,610
    • Diploma: -0.96% to £6,735
    • Halma: -1.70% to £3,578
    • Antofagasta: -1.43% to £3,724

    Corporate Updates

    ME Group Reaffirms Profit Guidance

    ME Group has expanded into user-operated dog washing machines to recover from the revenue hit caused by the Iran war. The firm installed 200 machines across the UK, France, and the Republic of Ireland, noting they are proving popular. Revenue slipped 1% to £152 million on a constant currency basis in the six months to end of April, while pre-tax profit fell 6% to £32 million.

    PageGroup Profit Declines 5.4%

    Recruiter PageGroup reported a 5.4% drop in second-quarter profit to £21.8 million, an improvement from the 11.4% decline in the prior quarter. Temporary recruitment rose 1%, outperforming permanent recruitment, which fell 8%. Group profit remained flat at £197.6 million, with about half of operating markets seeing growth, particularly southern Europe.

    Plus500 Half-Year Revenue Jumps 12%

    Plus500 reported its highest half-year revenue in three years at $462.9 million, up 12% year-over-year. Customer income rose 24% to a five-year record of $460.8 million. Underlying EBITDA edged up 1% to $187.5 million, though the margin slipped to 41% from 45% due to increased spending on customer acquisition and US investment.

    Global Market Overview

    US futures pointed lower, with the Nasdaq expected to fall 1.3%, while the Dow Jones and S&P 500 were seen dropping 0.35% and 0.55%, respectively. In Asia, Tokyo’s Nikkei 225 fell 1.92% to 67,242.73, China’s Shanghai Composite dropped 2.06%, and Hong Kong’s Hang Seng edged up 0.064%. Australia’s S&P/ASX 200 rose 0.03%. In India, the Nifty 50 and Sensex advanced 0.14% and 0.11%, respectively.

  • Indian Stock Markets End Flat Amid US-Iran Tensions and Oil Price Surge

    Indian Stock Markets End Flat Amid US-Iran Tensions and Oil Price Surge

    Indian equity benchmarks ended Monday’s session on a mixed note as escalating geopolitical tensions between the United States and Iran sent crude oil prices soaring, fueling inflation concerns and dampening investor sentiment. The Sensex recovered from early losses to close 83 points higher at 77,653, while the Nifty 50 pared its intraday decline to end nearly flat at 24,202.

    Markets opened sharply lower after renewed military exchanges in the Middle East pushed Brent crude nearly 4% higher to around $79 a barrel. The surge in oil prices raised worries about India’s import bill, corporate profitability, and the possibility of prolonged higher interest rates. Weak global cues, a softer rupee, and cautious trading ahead of the first-quarter earnings season added to the pressure.

    Key Market Movers

    Despite the weak start, selective buying in heavyweight stocks helped benchmarks recover. IT stocks led the rebound, with the Nifty IT index surging around 4%. Tata Consultancy Services (TCS) rallied 8% over two sessions after announcing a multi-year AI-powered network transformation deal with ABB. Infosys and HCLTech also gained. ICICI Bank held near Rs. 1,400, while Axis Bank saw mild profit booking.

    Kalyan Jewellers extended its 47% rally after a strong Q1 business update, though analysts flagged elevated valuations. Goodluck India rose nearly 3% on a 2:1 bonus share announcement. Meanwhile, Swiggy slipped over 2% after the FSSAI issued nine notices to its Instamart unit over alleged violations.

    Geopolitical and Global Impact

    Escalating US-Iran tensions triggered a global risk-off sentiment. Brent crude climbed to $78.68 a barrel, and the US dollar strengthened. Japan’s Nikkei fell nearly 2%, and South Korea’s Kospi plunged 9% as SK Hynix tumbled 15% after profit booking. Gold prices dropped more than 1% as rising oil revived inflation fears. The Indian rupee weakened to a one-month low of 95.76 per dollar, though likely RBI intervention limited losses.

    India’s Volatility Index (VIX) surged over 9%, reflecting heightened investor caution. Foreign institutional investors (FIIs) pulled $46 billion from emerging market equities in June, with heavy selling in South Korea and Taiwan tech stocks. However, FIIs trimmed stakes in nearly 280 BSE 500 companies yet some stocks rallied up to 220% in three months.

    Analyst Views and Outlook

    Goldman Sachs turned optimistic on Indian equities, projecting the Nifty 50 to reach 26,500 by June 2027. Axis Direct’s Rajesh Palviya said the near-term trend remains positive as long as Nifty holds above 24,100, with upside targets of 24,350 and 24,550. InvestorAI remains overweight on jewellery, cement, and healthcare, betting on domestic demand resilience. However, it warned that Brent crude above $80 per barrel is the biggest near-term risk, especially if Strait of Hormuz disruptions persist.

    Market participants will closely watch US inflation data due on July 14, Fed Chair Kevin Warsh’s congressional testimony, and further developments in the Middle East for directional cues.

  • HCL Tech Stock Rises Ahead of Q1 FY27 Results: Analyst Views on Buy or Sell

    HCL Tech Stock Rises Ahead of Q1 FY27 Results: Analyst Views on Buy or Sell

    HCL Technologies shares edged higher by 1.68% in early trading on Monday, July 13, 2026, as investors awaited the company’s Q1 FY27 results. The stock opened at Rs. 1,162, compared to the previous close of Rs. 1,164.10, and reached an intraday high of Rs. 1,183.70 on the NSE.

    Market participants are closely watching the June quarter numbers, management commentary, full-year guidance, deal pipeline, AI-driven business opportunities, and margin performance. The board is also expected to consider a second interim dividend for FY27 alongside the Q1 results.

    Q1 Results Preview

    Axis Securities projects a 3.5% quarter-on-quarter revenue growth for HCL Tech, supported by rupee depreciation, though client-specific headwinds and seasonal softness in the software business may act as drags. The brokerage notes that EBIT margins could decline by 40 basis points sequentially due to restructuring costs and higher investments. Key areas to watch include management’s outlook on Services and ERD businesses, software performance, deal pipeline, and FY27 revenue guidance.

    Seema Srivastava, Senior Research Analyst at SMC Global Securities, expects a softer quarter amid reduced discretionary tech spending, slower client decisions, and macroeconomic uncertainty in major global markets. She added, “Services revenue is likely to remain under pressure, though steady execution of long-term digital transformation programs should provide some support. Margins may improve sequentially due to favorable currency movements, higher utilization, productivity initiatives, and cost controls, partially offset by annual wage revisions and continued AI investments.”

    Key Factors to Watch

    Investors will track whether HCL Tech can sustain its constant-currency revenue growth guidance of 1%-4% for FY27. In Q4 FY26, the company reported a consolidated net profit of Rs. 4,488 crore (up 4.2% YoY) and revenue from operations of Rs. 33,981 crore (up 12% YoY). CEO and MD C. Vijayakumar emphasized that the company’s top priority for FY27 is positioning itself to capitalize on AI opportunities for multi-decade value creation.

    Share Performance

    HCL Tech shares have delivered over 21% returns over the past five years and 6% over three years. However, the stock has declined 28.2% over the last year and is down 28% year-to-date. In the past month, it gained 6%, and over the last five trading sessions, it rose 3.7%. The 52-week high stands at Rs. 1,780.10 (February 3, 2026), while the 52-week low is Rs. 1,030 (July 1, 2026).

    Should You Buy or Sell HCL Tech?

    Market experts remain cautious ahead of the results. Harshal Dasani, Business Head at INVasset PMS, said, “The risk-reward equation is not favorable for chasing HCL Tech before results. If management delivers stable guidance with confidence around execution and improving client spending, the long-term investment case remains constructive. A staggered approach after results offers a better risk-reward than an aggressive pre-result position.”

    Mahesh M Ojha of Kantilal Chhaganlal Securities advised investors to avoid taking new positions before earnings, noting that IT stocks often experience volatile swings during such periods.

    Disclaimer: This article is for informational purposes only and does not constitute investment advice. Readers should consult with a qualified financial advisor before making any investment decisions.